


In the realm of financial trading, understanding technical indicators is crucial for making informed decisions. Among these indicators, the Relative Strength Index (RSI) stands out as a powerful tool for assessing market momentum and identifying potential trading opportunities. By delving into the depths of RSI, traders can enhance their trading strategies and increase their chances of profitability.
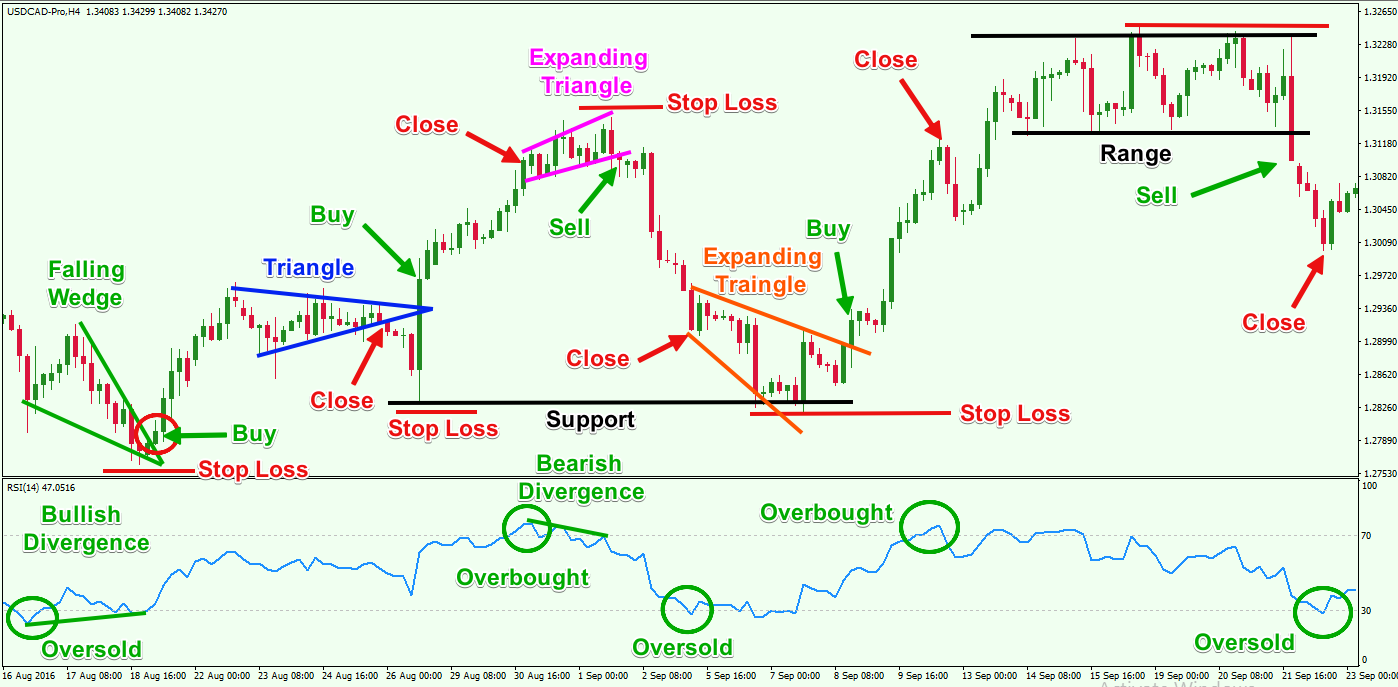
Image: chrryt.space
What is the Relative Strength Index (RSI)?
The Relative Strength Index is a technical analysis indicator that measures the magnitude of recent price changes to determine whether an asset is overbought or oversold. It ranges from 0 to 100, with values above 70 indicating an overbought condition and values below 30 suggesting an oversold market. Traders use RSI to gauge market momentum and gauge the potential for a trend reversal.
RSI Calculation: Demystified
The RSI is calculated using the following formula:
RSI = 100 – (100 / (1 + RS))
where RS is the positive close-to-close changes during n periods divided by the negative close-to-close changes during the same period.
RSI Interpretation: A Practical Guide
Overbought Conditions (RSI above 70): When the RSI crosses above 70, it signals that the asset may be overbought and vulnerable to a price correction or reversal. Traders often interpret this as a potential sell signal.
Oversold Conditions (RSI below 30): Conversely, when the RSI drops below 30, it indicates that the asset may be oversold and ripe for a potential price rebound or reversal. Traders might consider this a buying opportunity.
Trend Confirmation: The RSI can also be used to confirm established trends. If the price is rising and the RSI is above 50, it often indicates that the uptrend is likely to continue. Conversely, if the price is falling and the RSI is below 50, it suggests that the downtrend may persist.
Divergence: Traders also look for divergence between the price and the RSI. Bullish divergence occurs when the price makes a new low, but the RSI does not. This suggests that the market may be oversold and a trend reversal is imminent. Bearish divergence occurs when the price makes a new high, but the RSI does not. This indicates potential overbought conditions and a possible trend reversal.
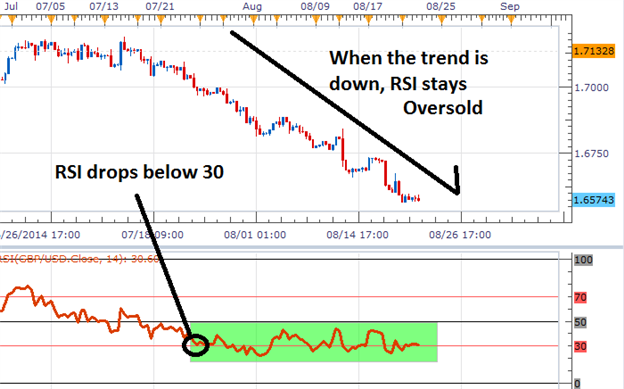
Image: www.mql5.com
RSI Trading Strategies: Turning Theory into Practice
Simple RSI Strategy: This strategy involves buying when the RSI dips below 30 (oversold) and selling when it climbs above 70 (overbought). However, it’s essential to combine this with other technical indicators to filter false signals.
Divergence Trading: By monitoring the divergence between price and RSI, traders can anticipate potential trend reversals. For instance, a bullish divergence could signal an opportunity to buy, while a bearish divergence might suggest a sell signal.
Trend Confirmation Strategy: Using the RSI to confirm established trends can bolster trading confidence. If the price is trending up and the RSI is above 50, it can provide added assurance that the uptrend has staying power. Conversely, if the price is trending down and RSI is below 50, it can corroborate the strength of the downtrend.
Trading Options With Rsi
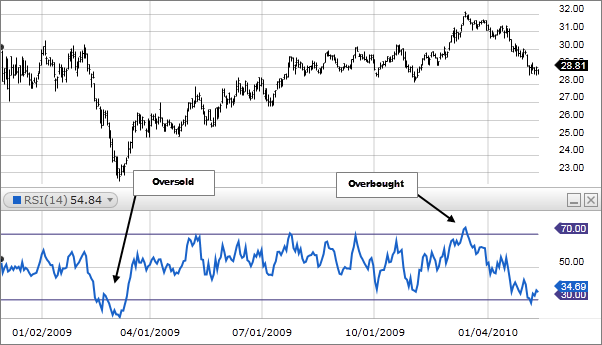
Image: www.fidelity.com
Conclusion: Unlocking the Power of RSI
In the realm of options trading, the Relative Strength Index (RSI) reigns supreme as an invaluable tool for evaluating market momentum and unearthing potential opportunities. By comprehending its intricacies and incorporating it into your trading strategies, you can harness the power of RSI to make informed decisions and increase your chances of profitability. Remember to combine RSI with other technical indicators to refine your analysis and minimize the risk of false signals.


