When it comes to day trading options, the right indicators can make all the difference between profit and loss. These technical analysis tools provide valuable insights into market trends and help traders identify potential trading opportunities. In this comprehensive guide, we will delve into the world of day trading indicators, exploring the best options for enhanced accuracy and profitability.

Image: forexpops.com
Before we dive into the specifics of individual indicators, it’s important to understand the fundamental principles underlying their effectiveness. Technical indicators are mathematical calculations based on historical price data. By analyzing patterns and trends in this data, traders can make educated predictions about future price movements. However, it’s crucial to remember that indicators are not crystal balls; they are simply tools to supplement a trader’s analysis and risk management strategies.
Trending Indicators: Spotting Market Momentum
Trending indicators are designed to identify the direction and strength of a trend. These indicators provide a visual representation of the market’s momentum and help traders determine whether to buy or sell.
• **Moving Averages (MA)**: MAs calculate the average closing price over a specified period, such as 50 or 200 days. Traders often use multiple MAs to spot trend changes and potential support or resistance levels.
• **Exponential Moving Averages (EMA)**: EMAs give more weight to recent prices, making them more responsive to current market conditions than traditional MAs.
• **Bollinger Bands**: Bollinger Bands consist of three lines: a central MA and two bands that represent standard deviations above and below the MA. Traders use these bands to identify overbought and oversold conditions.
• **Parabolic Stop and Reverse Indicator**: This indicator uses a parabolic curve to identify potential trend reversals. Traders buy when the curve is below the price and sell when it is above the price.

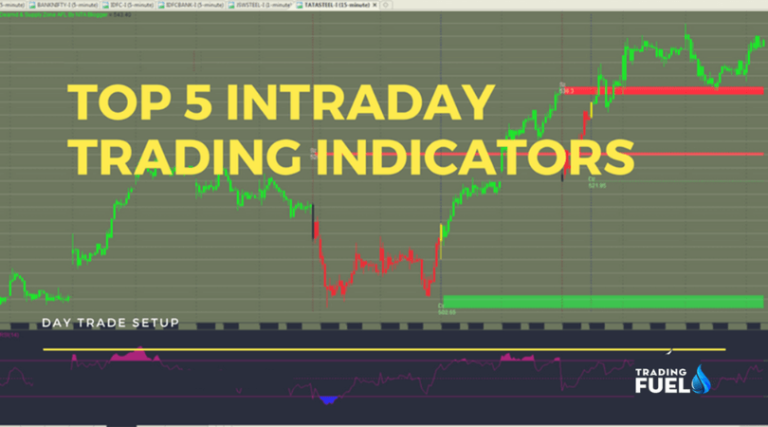
Image: www.tradingfuel.com
Best Indicators For Day Trading Options
Momentum Indicators: Measuring the Speed of Price Changes
Momentum indicators measure the speed and magnitude of price changes. They help traders identify overbought or oversold conditions and potential trend reversals.
• **Relative Strength Index (RSI)**: The RSI measures the magnitude of price changes over a specific period, typically 14 days. It ranges from 0 to 100, with values above 70 indicating overbought conditions and values below 30 indicating oversold conditions.
• **Stochastic Oscillator**: This indicator compares the current closing price to the range of prices over a specific period, typically 14 days. It also ranges from 0 to 100, with readings above 80 and below 20 considered overbought and oversold, respectively.
• **Commodity Channel Index (CCI)**: The CCI measures the difference between the current price and a moving average. It helps traders identify overbought and oversold conditions in trending markets.
…


