


In the realm of financial trading, binary options have emerged as a popular instrument that offers the potential for high returns in a short time. However, understanding the dynamics of binary options trading requires a deep grasp of market graphs, which are the visual representations of price fluctuations over time. This comprehensive guide will take you on a journey through binary options trading graphs, empowering you to decipher market movements and make informed trading decisions.

Image: www.youtube.com
Before delving into the complexities of graphs, let’s lay a solid foundation by defining binary options. Binary options are financial contracts where the trader predicts whether the underlying asset (e.g., stocks, currencies, commodities) will rise or fall within a specified period. If the prediction aligns with the actual price movement, the trader profits; otherwise, the entire investment is lost.
Understanding Binary Options Trading Graphs
Market graphs, also known as charts, are essential tools for binary options traders as they provide a visual representation of historical and real-time price movements. These graphs consist of two main components: the x-axis and the y-axis. The x-axis represents time, while the y-axis represents the price of the underlying asset.
There are various types of charts used in financial trading, each offering a unique perspective on the market. The most commonly used chart types in binary options trading are:
-
Line Charts: Line charts connect the closing prices of an asset over a period of time, creating a continuous line. They provide a simplified view of the overall price trend and are suitable for identifying support and resistance levels.
-
Bar Charts: Bar charts represent price movement within a specific period, typically a day, week, or month. They consist of vertical bars with the low, high, open, and close prices indicated. Bar charts offer more detailed information than line charts and are useful for analyzing market volatility.
-
Candlestick Charts: Candlestick charts are similar to bar charts but provide additional information about the market’s opening and closing prices through distinct visual representations called “candlesticks.” The color of the candlestick (green or red) indicates whether the closing price was higher or lower than the opening price. Candlestick charts are widely used in technical analysis to identify candlestick patterns that can signal potential market reversals or continuations.
Trading Strategies Using Binary Options Trading Graphs
Once you have a firm understanding of binary options trading graphs, you can employ various strategies to increase your chances of success:
-
Trend Trading: Trend trading involves identifying the overall direction of the market and trading in line with that trend. By analyzing the slope of a trendline (formed by connecting highs or lows on a chart), traders can determine whether to buy (for uptrends) or sell (for downtrends) binary options.
-
Range Trading: Range trading is based on the assumption that the price of an asset will fluctuate within a specific range. Traders identify support and resistance levels (price points where a trend reversal is likely to occur) and look for trading opportunities within those ranges.
-
Breakout Trading: Breakout trading involves identifying when the price of an asset breaks out from a previously established range or consolidation pattern. Traders anticipate that these breakouts will lead to significant price movements and place binary options accordingly.
-
Pullback Trading: Pullback trading is used to capitalize on temporary price retracements within the larger trend. Traders buy binary options during pullbacks (brief reversals against the trend) and sell when the trend resumes.
:max_bytes(150000):strip_icc()/dotdash_final_The_Most_Important_Technical_Indicators_For_Binary_Options_Dec_2020-01-c9d67ed0703c4661932ce96fcfa0573b.jpg)
Image: www.investopedia.com
Binary Options Trading Graphs
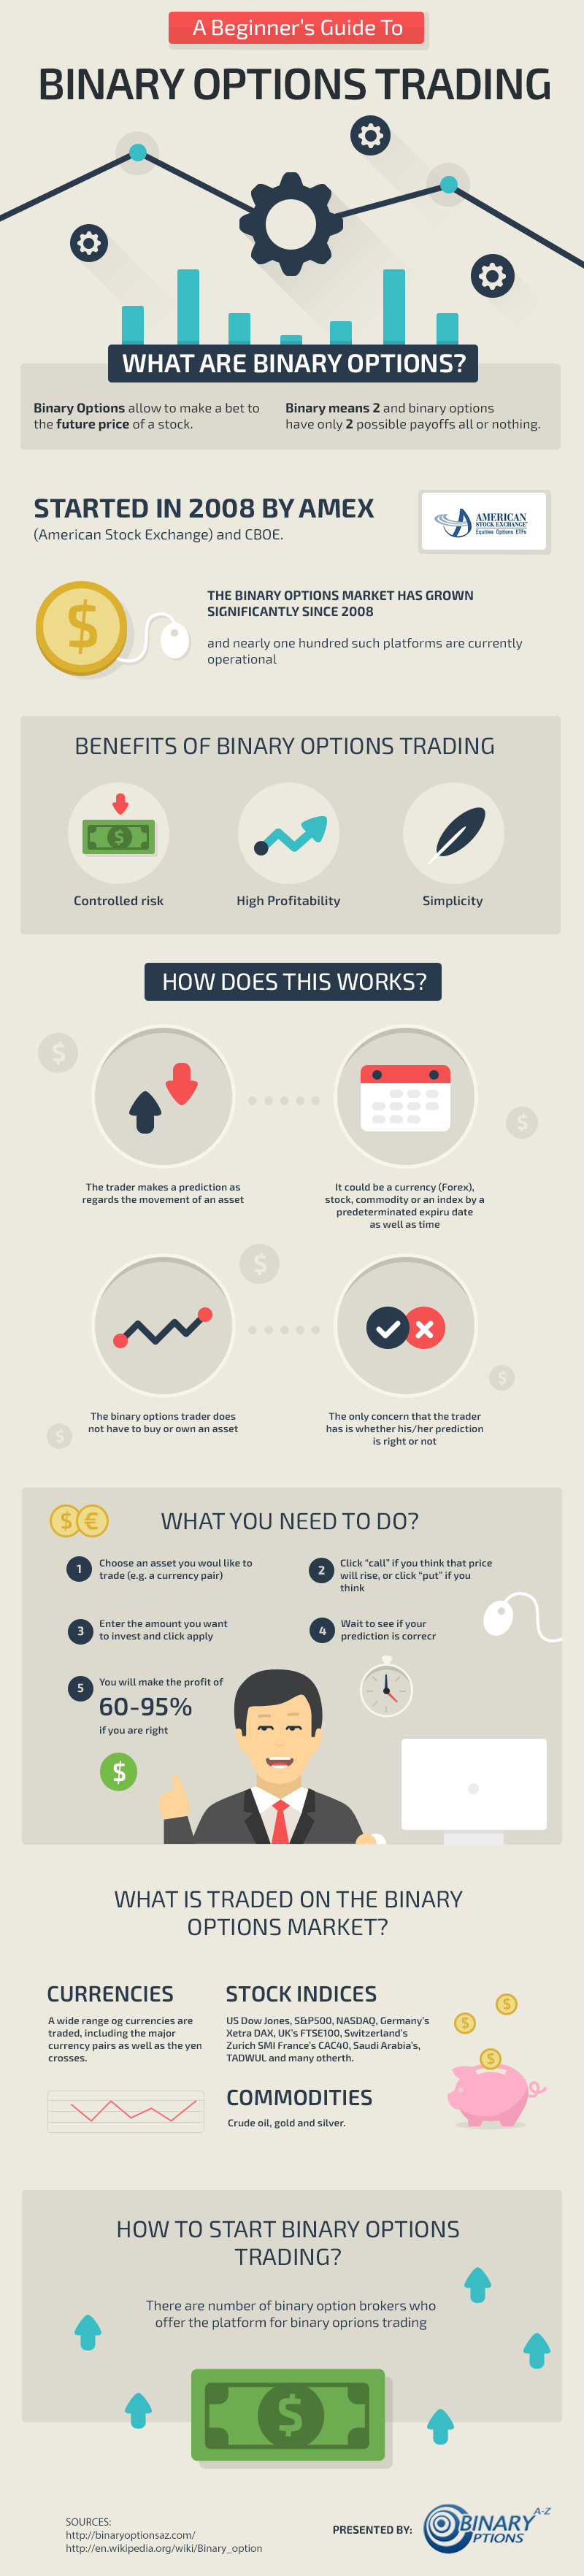
Image: www.infographicpost.com
Conclusion
Navigating the world of binary options trading requires a thorough comprehension of market graphs. By understanding the different types of charts, traders can gain invaluable insights into price movements, identify trading opportunities, and make informed decisions. Mastering binary options trading graphs is a crucial step towards maximizing your potential in this dynamic and potentially lucrative market.


