


An Objective Guide to Making Informed Decisions
Diving into the dynamic realm of options trading, it can be daunting to navigate the vast landscape of technical indicators. As a seasoned options trader, I’ve encountered countless indicators promising to unlock market secrets, but not all are created equal. In this comprehensive guide, we will delve into the intricacies of options trading indicators, exploring their strengths and limitations to equip you with the knowledge to make informed trading decisions.
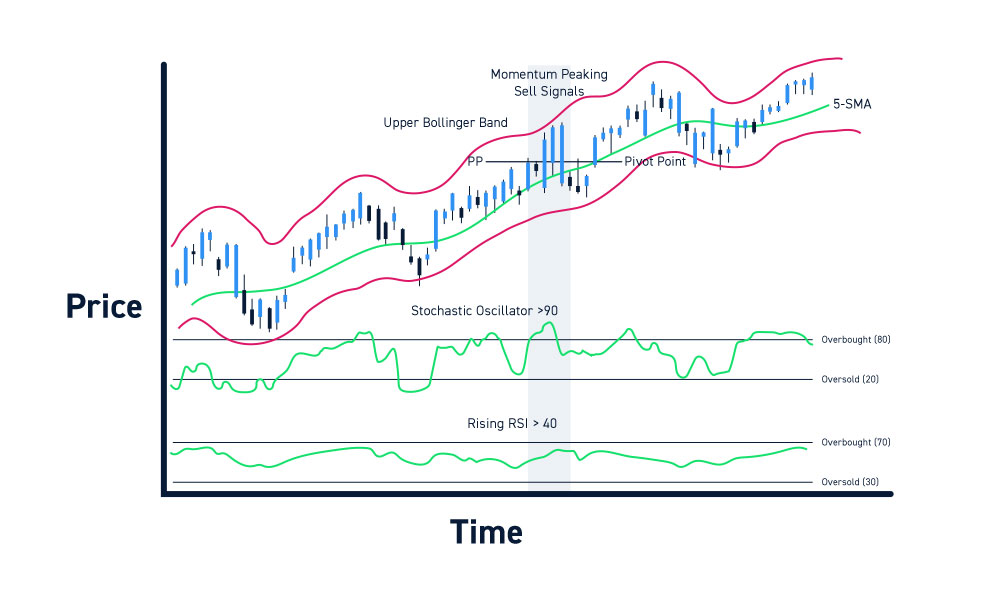
Image: centerpointsecurities.com
Before embarking on this exploration, it’s essential to acknowledge that no single indicator holds the ultimate key to successful options trading. Technical analysis is an art of synthesis, where multiple indicators are combined to form a comprehensive market assessment. Thus, our focus will be on identifying the most reliable and effective indicators to complement your trading strategy.
Simple Moving Average (SMA) and Exponential Moving Average (EMA)
Simple Moving Average (SMA) and Exponential Moving Average (EMA) are widely recognized as foundational indicators in options trading. These indicators smooth out price data by calculating a moving average over a specified period. While the SMA takes a straightforward average, the EMA places greater weight on recent prices, making it more responsive to market shifts. Both SMA and EMA can be valuable for identifying trends and support and resistance levels.
Bollinger Bands
Bollinger Bands, introduced by legendary trader John Bollinger, are a volatility-based indicator that plots two standard deviations above and below a moving average. The bands expand and contract as volatility increases or decreases, providing insights into market momentum and potential overbought or oversold conditions. Bollinger Bands are particularly useful in conjunction with other indicators, such as price action or volume, to confirm trading signals.
Relative Strength Index (RSI)
Relative Strength Index (RSI), developed by J. Welles Wilder, measures the magnitude of price changes to assess whether an asset is overbought or oversold. Calculated over a specific period, RSI ranges between 0 and 100, where readings above 70 indicate overbought conditions and below 30 suggest the asset is oversold. RSI can be beneficial for identifying potential reversals or breakouts and can be combined with other indicators, such as support and resistance levels, to enhance signal strength.

Image: www.pinterest.co.uk
Stochastic Oscillator
Similar to RSI, the Stochastic Oscillator is another momentum indicator that gauges overbought and oversold conditions. It calculates the ratio between the most recent closing price and the price range over a specified period. Unlike RSI, the Stochastic Oscillator is plotted on a scale of 0 to 100, with readings above 80 indicating overbought and below 20 signaling oversold. This indicator can be effective in detecting short-term trend reversals or identifying potential trading opportunities.
Conclusion: Empowering Your Options Trading
While these indicators provide valuable insights, it’s crucial to remember that no single indicator guarantees success. Effective options trading requires a holistic approach that combines technical analysis, fundamental analysis, and a sound trading plan. By skillfully combining multiple indicators and considering market conditions, traders can refine their decision-making and increase their chances of successful outcomes. This article equips you with a robust foundation of indicators to enhance your options trading journey. Remember, continual learning and adaptation are key to mastering the nuances of this dynamic financial instrument.
Are you eager to delve deeper into the world of options trading indicators? I encourage you to explore further resources, engage in discussions with other traders, and stay abreast of the latest developments in technical analysis. Empower yourself with knowledge and make informed decisions that can elevate your options trading to new heights.
Which Indicators Are Best For Options Trading
Image: bullsonwallstreet.com
Frequently Asked Questions
- Q: Can I rely solely on one technical indicator for options trading?
A: It is not advisable to rely on any single indicator for options trading. Combining multiple indicators and considering market conditions is essential for comprehensive market analysis and informed trading decisions.
- Q: Which indicator is considered the most reliable for options trading?
A: There is no single indicator that can be definitively labeled as the most reliable for options trading. Different indicators provide varying insights, and their effectiveness depends on the specific market conditions and trading strategy.
- Q: How do I determine the optimal settings for technical indicators?
A: The optimal settings for technical indicators can vary based on the underlying asset, trading strategy, and market conditions. Experimentation and backtesting are recommended to identify the settings that best suit your individual trading needs.


