


Image: www.youtube.com
In the fast-paced world of binary options trading, understanding the nuances of market behavior is crucial. Candlesticks emerge as a versatile tool that provides valuable insights into price action, empowering traders to make informed decisions. This comprehensive guide will delve into the intricacies of identifying candlestick patterns, giving you the edge in successfully navigating binary options markets.
Understanding Candlesticks
A candlestick is a graphical representation of price movement over a specific period, typically 15 minutes, 30 minutes, or hourly. It consists of a vertical line called the “body,” indicating the opening and closing prices. Shadows, known as “wicks,” extend from the body to show the highest and lowest points reached during that period.
By analyzing the size, shape, and color of candlesticks, traders can identify patterns that suggest future price direction. Candlestick patterns are categorized into bullish (indicating an upward trend) and bearish (indicating a downward trend).
Bullish Candlestick Patterns
- Green/White Hanging Man (Hammer): A small body near the low with a long lower wick signifies a potential trend reversal from bearish to bullish.
- Bullish Engulfing: A long green/white candlestick completely engulfing a previous red/black candlestick, pointing to a potential breakout.
- Morning Star: A red/black candlestick, followed by a small green/white candlestick, and then another long green/white candlestick, suggesting a reversal of a downtrend.
Bearish Candlestick Patterns
- Red/Black Shooting Star (Inverted Hammer): Similar to the Hanging Man but with a long upper wick, indicating a potential reversal from bullish to bearish.
- Bearish Engulfing: A long red/black candlestick completely engulfing a previous green/white candlestick, hinting at a potential breakdown.
- Evening Star: A green/white candlestick, followed by a small red/black candlestick, and then another long red/black candlestick, suggesting a reversal of an uptrend.
Identifying High-Probability Trading Opportunities
To enhance trading profitability, it’s essential to identify candlestick patterns that coincide with broader market trends. Support and resistance levels, along with market momentum, play a significant role in confirming potential trading setups.
For instance, identifying a bullish Engulfing candlestick at a support level within an uptrend can indicate a high-probability buy opportunity. Conversely, a bearish Engulfing candlestick at a resistance level in a downtrend suggests a sell opportunity.
Additional Technical Indicators
In addition to candlestick patterns, it’s recommended to utilize other technical indicators to strengthen your analysis. Moving averages and oscillators, such as the Relative Strength Index (RSI) or the Stochastic Oscillator, provide complementary insights into market momentum and overbought/oversold conditions.
Conclusion
Understanding and applying candlestick patterns in binary options trading is a valuable skill that can significantly improve decision-making and profitability. By incorporating candlestick analysis into your trading strategy, you gain an edge in identifying potential trends, reversals, and high-probability trading opportunities. Remember to combine candlestick patterns with other technical indicators and adhere to proper risk management principles to optimize your trading success.
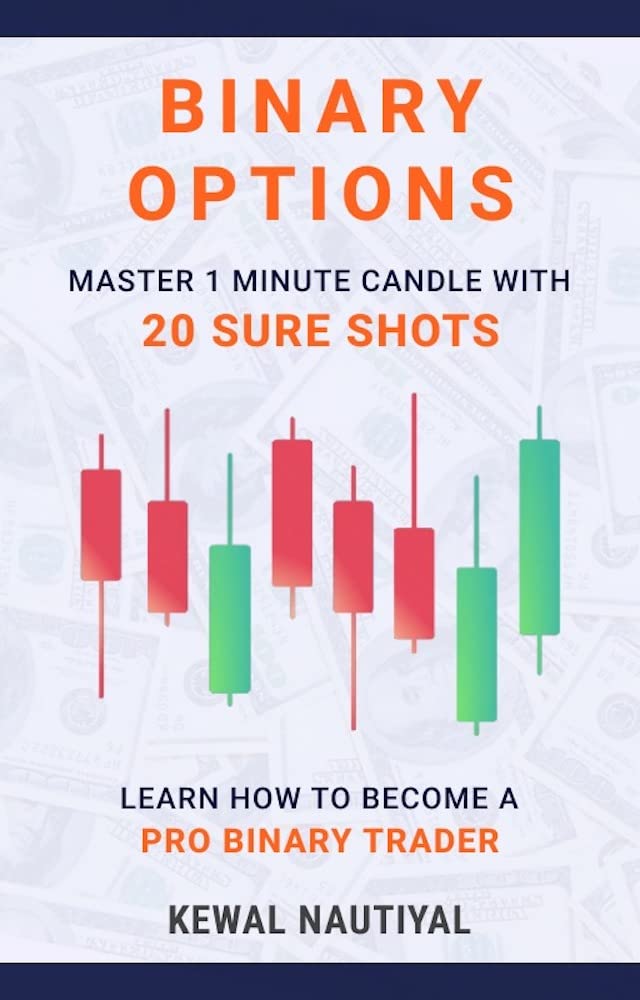
Image: www.goodreads.com
Trading Binary Options Using Candlesticks

Image: www.studypool.com


