Introduction
In the fast-paced and ever-evolving world of option trading, having a reliable indicator that can provide insights into market momentum is crucial for making informed decisions. The Moving Average Convergence Divergence (MACD) indicator has proven to be a powerful tool for traders who seek to identify potential trading opportunities in the market. This comprehensive guide will delve into the fundamentals of the MACD indicator, explaining its concepts, applications, and strategies for successful option trading.

Image: o3schools.com
The MACD indicator was developed by Gerald Appel in the late 1970s and has since gained widespread recognition among traders for its ability to capture the relationship between two exponential moving averages (EMAs). It is commonly utilized to gauge market momentum, identify potential trend reversals, and pinpoint entry and exit points for profitable option trades.
Understanding the MACD Indicator
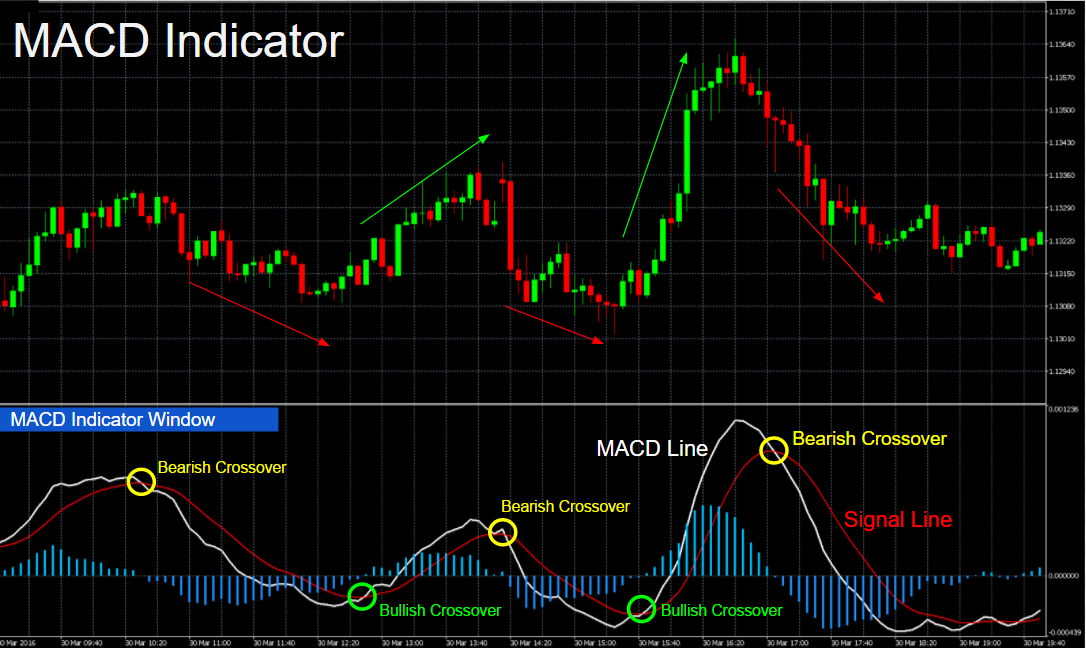
The MACD indicator comprises three main components:
- The MACD line: Calculated by subtracting the 26-period EMA from the 12-period EMA.
- The Signal line: A 9-period EMA of the MACD line.
- The MACD histogram: A graphical representation of the difference between the MACD line and the Signal line.
The MACD line, as a gauge of short-term momentum, fluctuates above and below the zero line. When the MACD line is positive, it indicates bullish momentum, while negative values denote bearish momentum.
The Signal line, serving as a smoother indicator of momentum, helps traders identify potential trend changes. When the MACD line crosses above the Signal line, it often signals a bullish trend. Conversely, when the MACD line falls below the Signal line, it suggests a bearish trend.
The MACD histogram adds an additional layer of visual information, aiding in identifying the strength and duration of market trends. Increasing bar heights in the histogram indicate rising momentum, while decreasing heights imply fading momentum.
Applying the MACD Indicator in Option Trading
The MACD indicator offers traders valuable insights for making informed option trading decisions:
- Trend Analysis: The MACD indicator can help traders identify the prevailing market trend by observing the relationship between the MACD line and the Signal line.
- Momentum Assessment: The MACD histogram provides traders with a visual representation of market momentum, aiding in determining the strength and direction of price movements.
- Trade Timing: Traders can utilize the MACD line and the Signal line crossovers to identify potential entry and exit points for option trades, aiming to capitalize on market momentum shifts.
It is important to note that while the MACD indicator is a powerful tool, it should not be used in isolation. Combining it with other technical indicators and fundamental analysis enhances the accuracy of trading decisions.
MACD Trading Strategies for Option Traders
Various trading strategies incorporate the MACD indicator:
- Crossover Strategy: Involves trading based on crossovers between the MACD line and the Signal line. A buy signal is generated when the MACD line crosses above the Signal line, and a sell signal is generated when it crosses below the Signal line.
- Divergence Strategy: This strategy capitalizes on divergences between the MACD indicator and price action. A bullish divergence occurs when prices reach lower lows while the MACD indicator forms higher lows, suggesting a potential trend reversal.
Traders should carefully evaluate the market context and consider risk management strategies before implementing any trading strategy.

Image: woodlands.adventist.org
Macd Indicator For Option Trading
https://youtube.com/watch?v=zIlrEy5wvCQ
Conclusion
The MACD indicator, with its ability to measure market momentum and identify potential trend reversals, has become a cornerstone for option traders. By understanding its components and incorporating it into their trading strategies, traders can enhance their decision-making process and increase their chances of success in the volatile world of option trading. It is crucial to approach the MACD indicator as a complementary tool, alongside other technical indicators and fundamental analysis, to make informed trading decisions that can potentially generate profitable returns.


