


Introduction
Options trading has emerged as a sophisticated financial strategy that can potentially magnify gains and mitigate risks in the ever-evolving investment landscape. Excel, with its unmatched capabilities for data analysis and visualization, has become an indispensable tool for options traders, empowering them to make informed decisions and develop effective trading strategies.
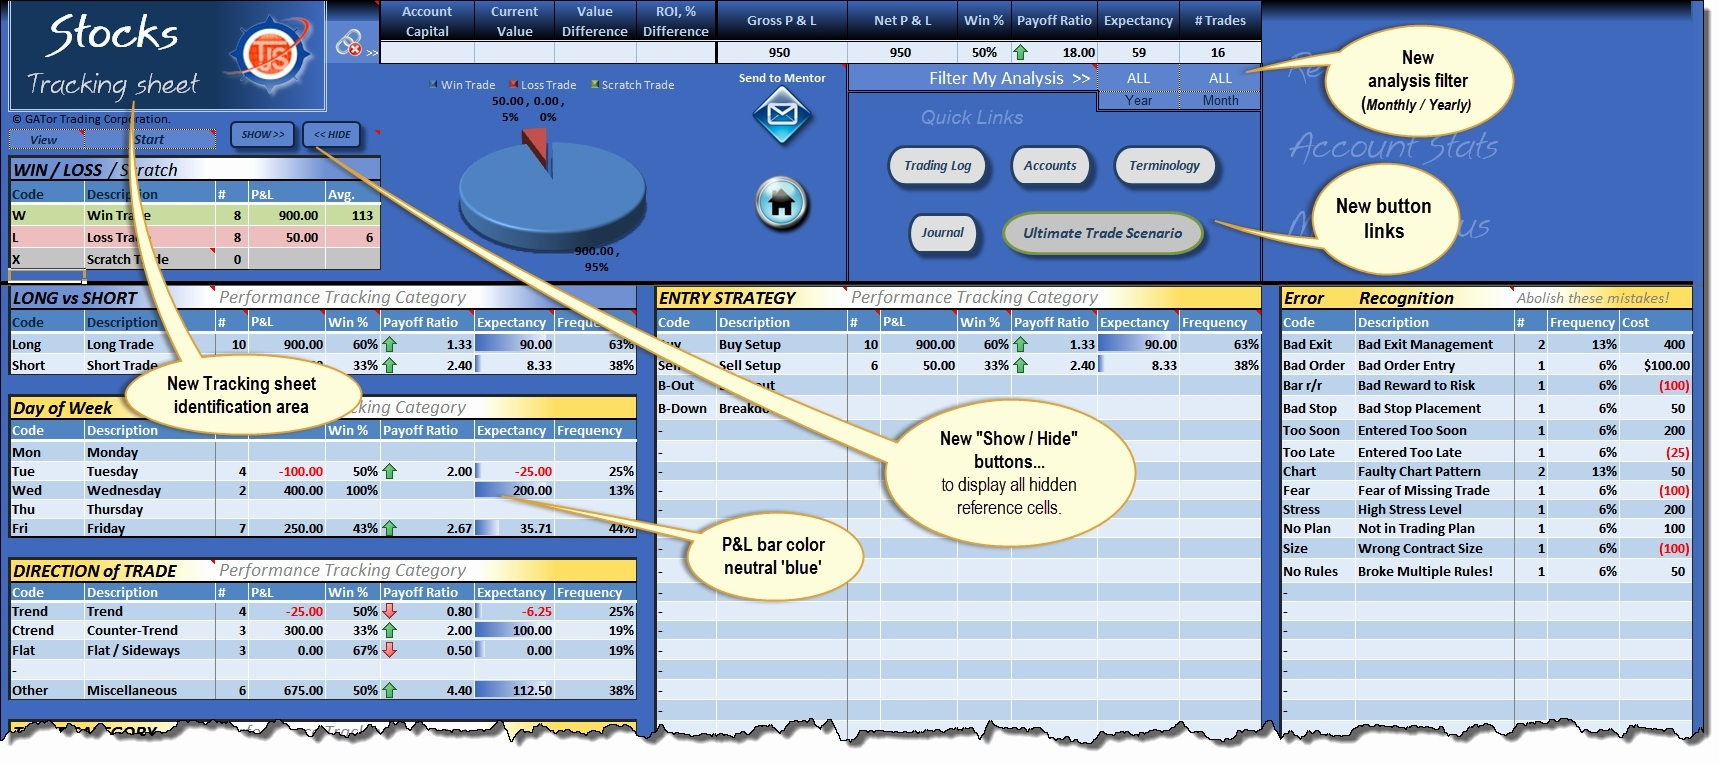
Image: db-excel.com
This article will delve into the realm of options trading with Excel, exploring the fundamental concepts, practical applications, and innovative techniques that can elevate your trading acumen. Whether you’re a novice trader venturing into the uncharted waters of options or a seasoned veteran seeking to refine your skills, this guide will equip you with the knowledge and insights to unlock the full potential of Excel in your options trading endeavors.
Delving into Options Trading
Options, financial contracts that derive their value from underlying assets, offer a unique blend of opportunity and risk. They grant the buyer the right, but not the obligation, to buy (call option) or sell (put option) the asset at a predetermined price (strike price) by a specified date (expiration date). The versatility of options makes them suitable for a wide range of trading strategies, including hedging, speculation, and income generation.
Excel as an Options Trading Toolkit
Excel’s robust functionality and customization options transform it into a versatile platform for options traders. Its spreadsheet capabilities enable the creation of customized spreadsheets tailored to specific trading needs. By leveraging formulas and functions, traders can automate calculations, analyze historical data, and generate dynamic visualizations that illuminate trading insights. Furthermore, Excel’s integration with third-party add-ins further enhances its capabilities, providing access to specialized tools for options pricing, risk analysis, and portfolio optimization.
Navigating the Excel Interface for Options Trading
Excel’s user-friendly interface makes it accessible to traders of all skill levels. The primary tools for options trading reside in the “Data” and “Formulas” tabs. The “Data” tab offers essential data manipulation capabilities, such as sorting, filtering, and creating data tables. The “Formulas” tab houses a comprehensive suite of financial functions, including those specifically designed for calculating options prices and Greeks (measures of risk and sensitivity).

Image: www.pinterest.com
Creating a Custom Options Trading Spreadsheet
Tailoring an Excel spreadsheet to your trading strategy is paramount. Start by creating a dedicated worksheet for each underlying asset you trade. Include columns for key data points, such as strike price, expiration date, bid and ask prices, volume, and Greeks. By organizing this information in a structured manner, you can quickly assess the options available for each asset and evaluate their potential profitability.
Implementing Options Pricing Formulas
Excel’s “Formulas” tab empowers you to calculate options prices with precision. The “BS” function, a cornerstone of options pricing, computes the Black-Scholes price for call and put options. By inputting the underlying asset price, strike price, expiration date, risk-free rate, and volatility, you can determine the theoretical value of the option. Additionally, Excel provides functions for pricing various types of options, such as American and European options, and exotic options.
Analyzing Greeks with Excel
Greeks play a pivotal role in understanding options risk and potential rewards. Excel functions like “DELTA,” “GAMMA,” “THETA,” and “VEGA” enable you to calculate these crucial metrics, which measure the sensitivity of an option’s price to changes in underlying asset price, time, interest rates, and volatility. By analyzing Greeks, you can develop trading strategies that mitigate risk and maximize profit potential.
Visualizing Options Data for Informed Decisions
Excel’s charting capabilities provide a powerful means to visualize options data and identify trading opportunities. Create line charts to track option prices over time, highlighting trends and reversals. Scatterplots can serve to analyze relationships between different Greeks or between options with different strike prices or expiration dates. By transforming data into visually appealing graphs, you can distill complex information into actionable insights.
Advanced Techniques for Enhanced Trading
Excel offers advanced techniques that elevate options trading to new heights. “Optimization” tools can automatically find the optimal option strategy for a given set of parameters, maximizing potential returns while minimizing risk. “Monte Carlo simulation” simulates thousands of scenarios to assess the probability of different outcomes, aiding in risk management. These advanced capabilities empower traders to make data-driven decisions and refine their trading strategies.
Options Trading Excel
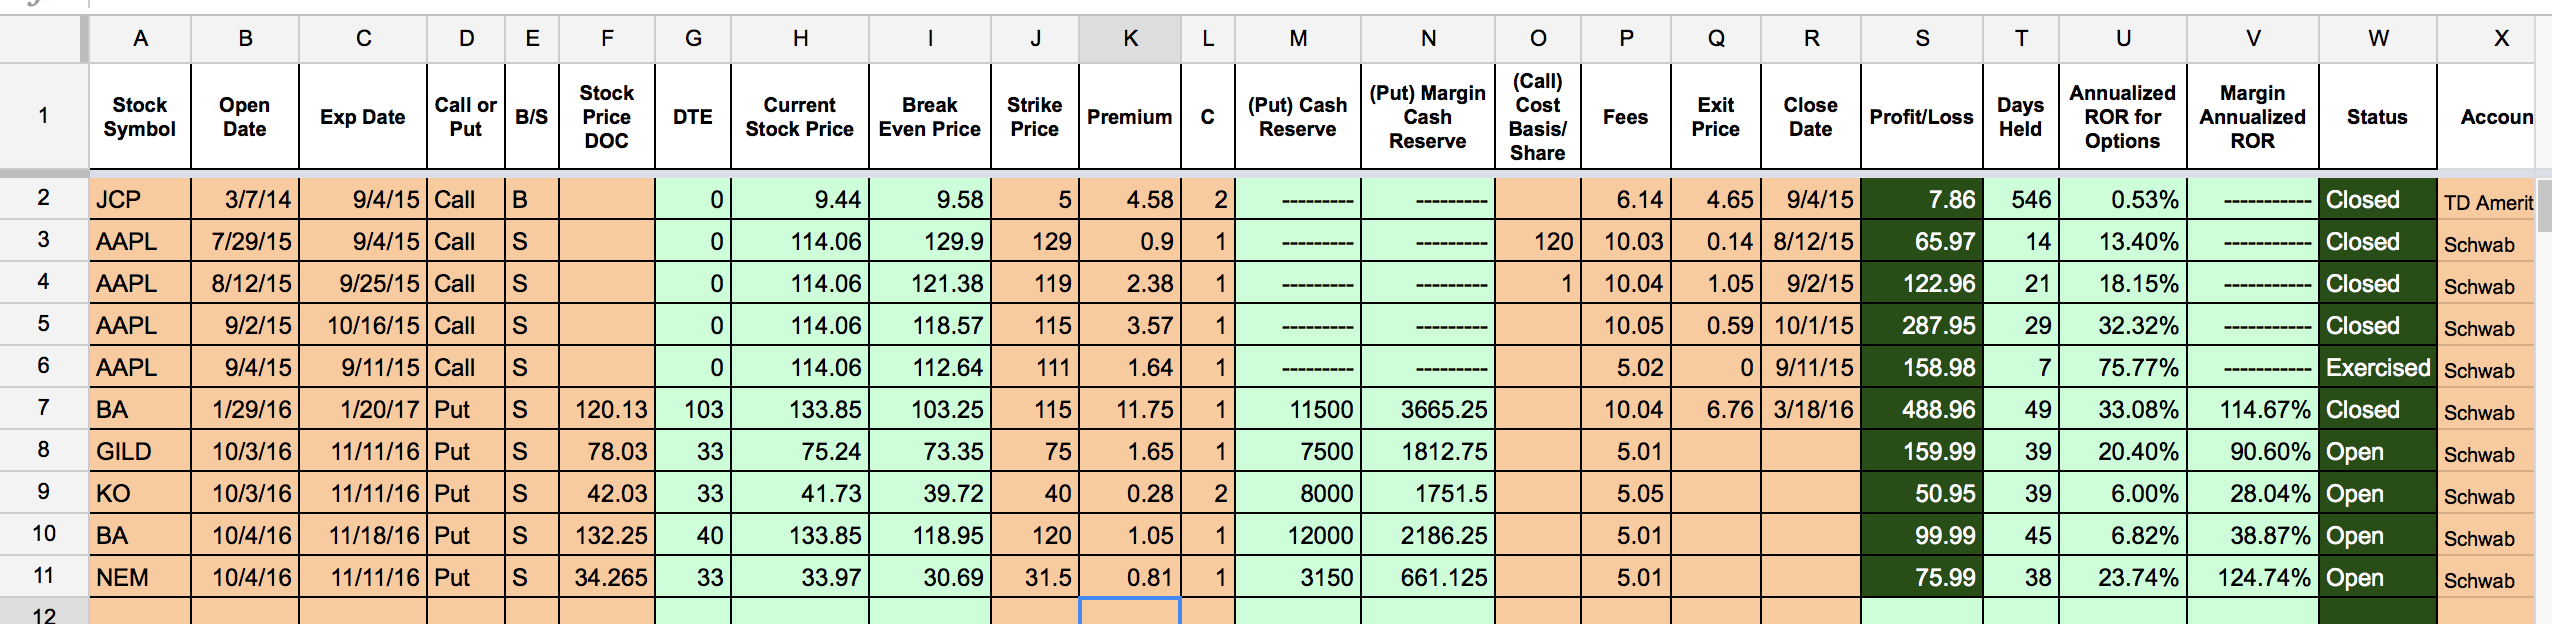
Image: db-excel.com
Conclusion
Options trading with Excel empowers traders with a powerful combination of flexibility, precision, and visualization. By harnessing Excel’s capabilities, you can customize your trading experience, calculate options prices with accuracy, analyze Greeks for risk assessment, visualize data for informed decision-making, and leverage advanced techniques to optimize your trading strategies. As you master the art of options trading with Excel, you’ll gain confidence in navigating the financial markets and increase your potential for success. Embrace this comprehensive guide as your roadmap to unlocking the boundless opportunities that Excel holds in the realm of options trading.


