


Price action trading is a trading technique that focuses on analyzing the price movements of an asset to predict future market behavior. It is a powerful approach that can help traders identify trading opportunities and make informed decisions, especially on the IQ Option platform.
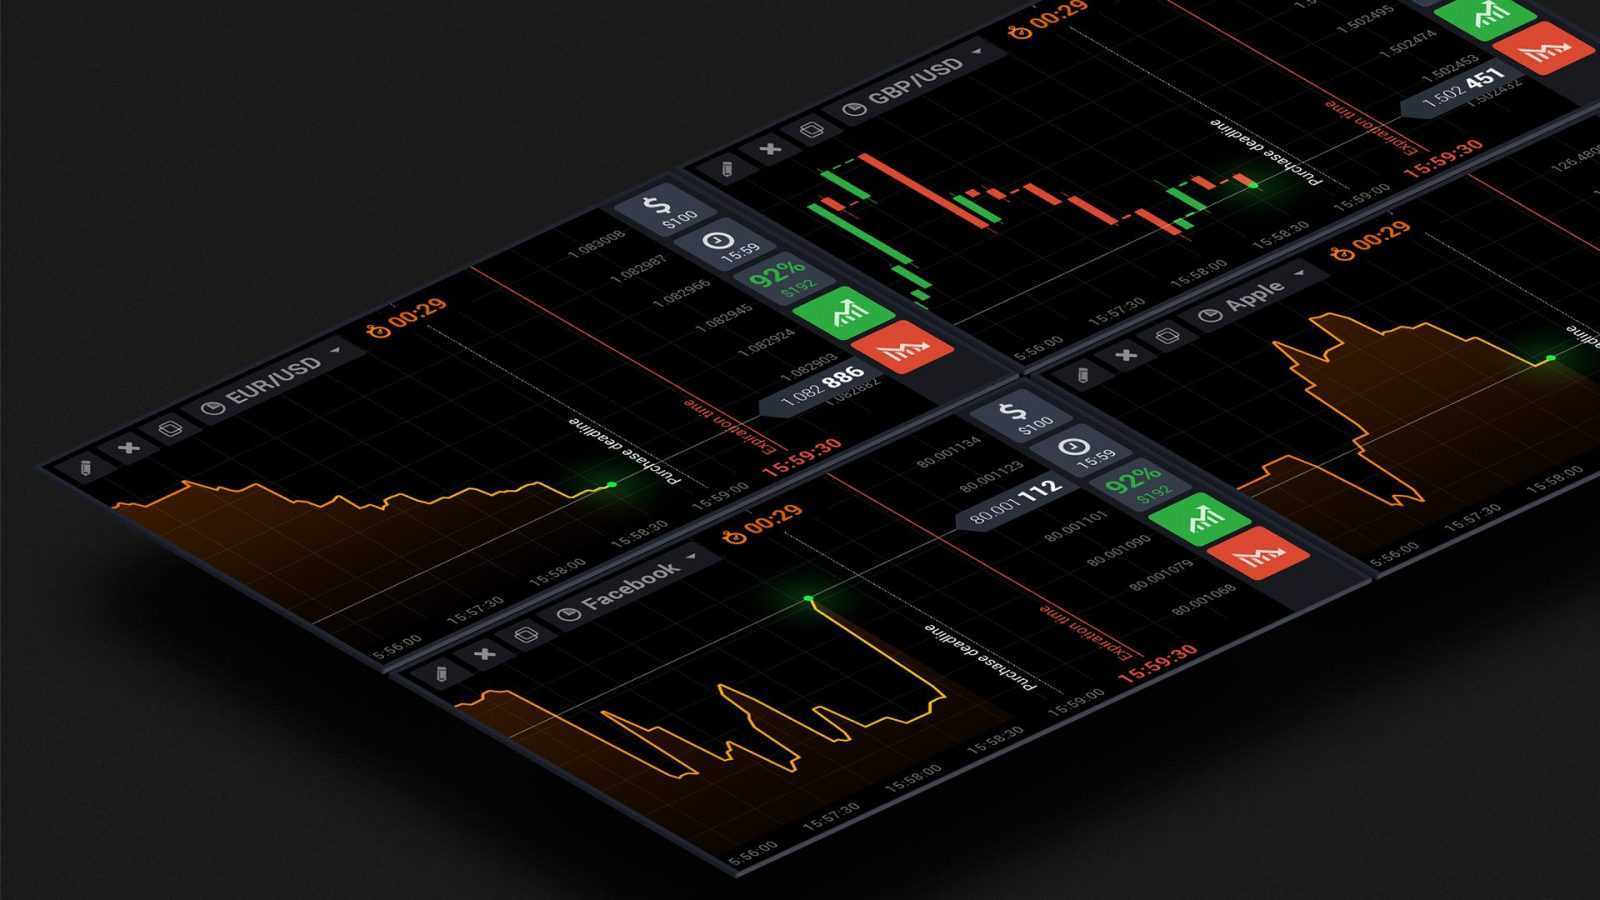
Image: blog.iqoption.com
IQ Option, a popular online trading platform known for its user-friendliness, provides traders with access to a wide range of financial instruments, including currency pairs, stocks, commodities, and ETFs. Understanding how to navigate price action patterns on IQ Option is crucial for profitable trading.
Understanding Price Action Trading Basics
Price action trading involves studying the price changes of an asset over time without relying on technical indicators or fundamental analysis. By analyzing candlestick patterns, chart formations, and support and resistance levels, traders aim to forecast future price movements and identify trading setups.
Candlestick patterns, such as bullish hammer or bearish engulfing, provide insights into market sentiment and potential trend reversals. Chart formations, such as triangles or flags, indicate consolidation or breakout opportunities. Support and resistance levels mark important price areas where buyers or sellers dominate, helping traders identify potential reversal points.
Benefits of Price Action Trading
Price action trading offers several advantages over other trading techniques:
- Simplicity: It relies on direct observation of price movements, making it accessible to traders with different experience levels.
- Less Data Reliance: It doesn’t require extensive historical data or complex calculations, making it practical for both short-term and long-term trading.
- Timeliness: Price action analysis provides real-time insights into market movements, enabling traders to respond swiftly to changing market conditions.
- Adaptability: It can be applied to various trading instruments and timeframes, providing traders with versatility in their trading strategies.
Key Price Action Patterns to Watch for
- Bullish Hammer: A candlestick with a small body and long lower shadow, indicating a potential buy opportunity.
- Bearish Engulfing: A candlestick where the bearish candle completely engulfs the previous bullish candle, signaling a potential sell signal.
- Triangle: A chart pattern formed by connecting three highs and three lows, indicating a consolidation period with a potential breakout.
- Flag: A chart pattern consisting of two parallel trendlines and a breakout, offering continuation or reversal trading opportunities.
- Support and Resistance Levels: Horizontal price areas where price tends to bounce back when reached, indicating potential turning points.
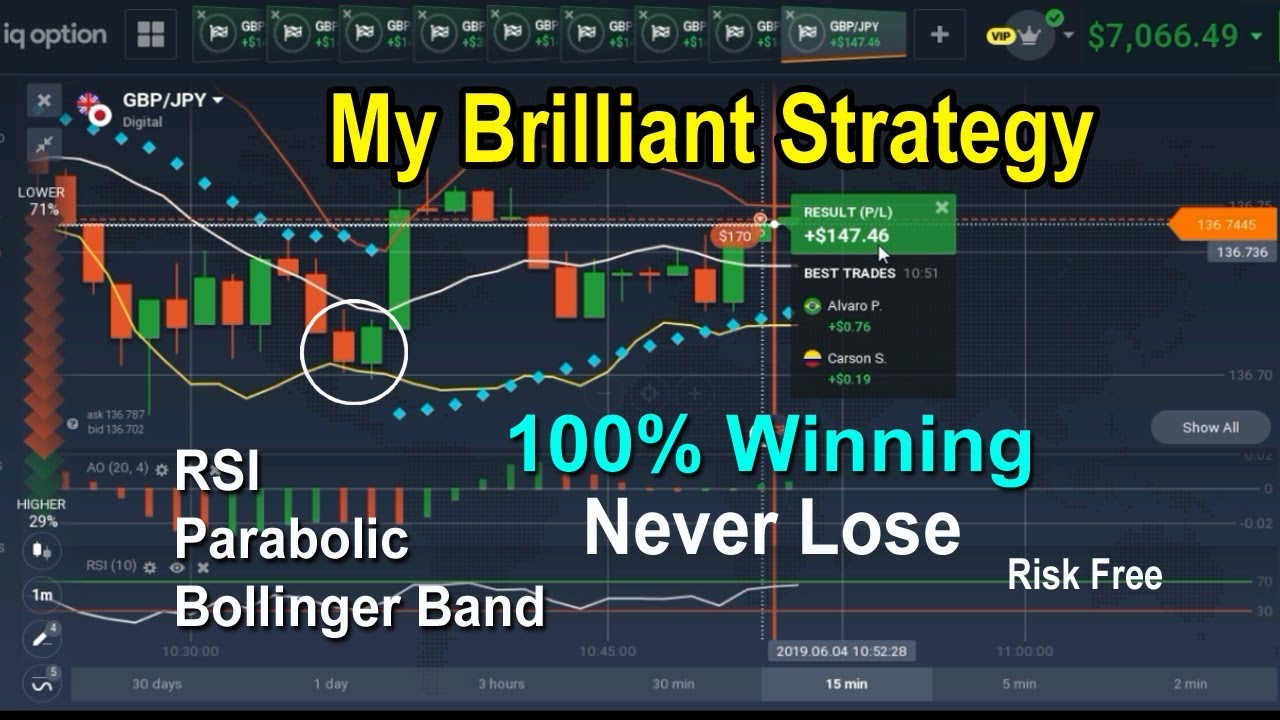
Image: www.youtube.com
Using Price Action Trading on IQ Option
IQ Option provides the necessary tools and features for successful price action trading:
- Customizable Charts: Traders can choose from various chart types and timeframes to suit their trading style.
- One-Click Trading: The platform allows for instant execution of trades directly from the chart, ensuring timely market entry and exit.
- Practice Mode: Traders can hone their price action trading skills in a risk-free environment using the platform’s demo account.
Price Action Trading Iq Option

Image: www.iqoptionwiki.com
Conclusion
Price action trading is an effective technique that can enhance trading performance on IQ Option and beyond. By analyzing price movements, traders can gain valuable insights into market sentiment and identify high-probability trading opportunities. Embracing price action trading can empower traders with a deeper understanding of market dynamics and improve their chances of success in the financial markets.


