


Unlock the Power of Options Trading with Bar Charts
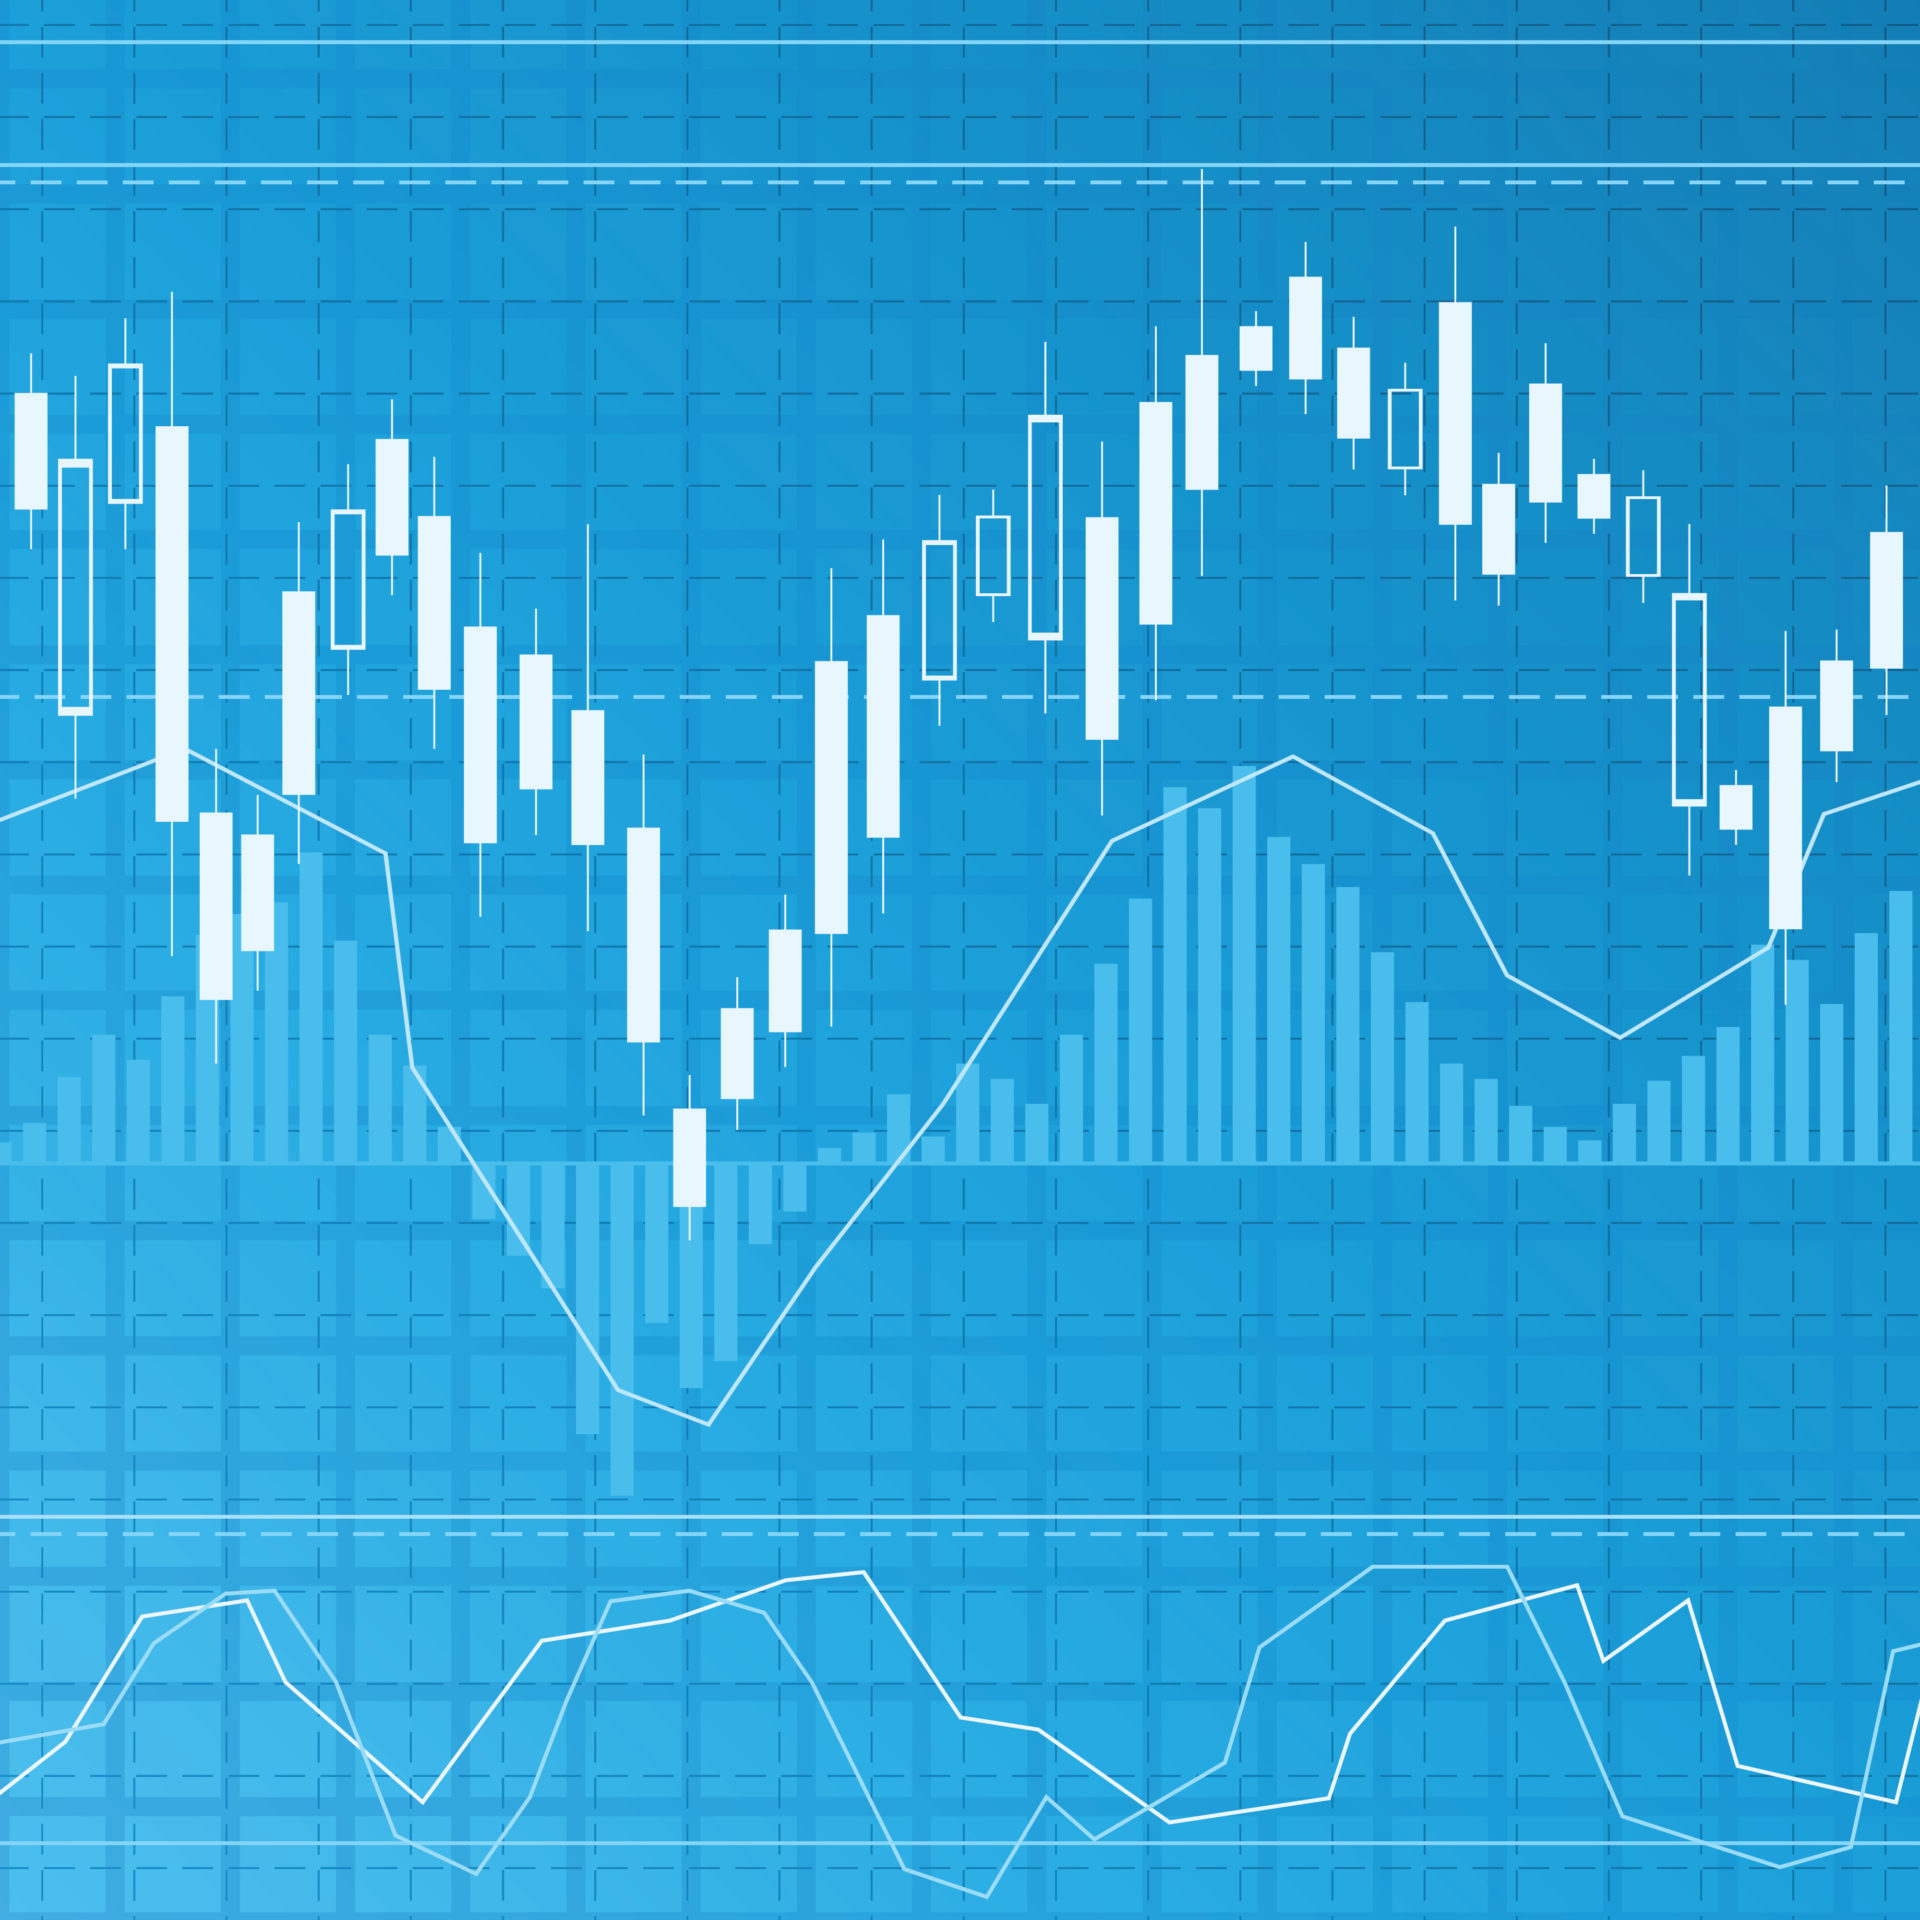
Image: ustradingcoach.com
In the realm of financial markets, options trading has emerged as a formidable tool for discerning investors and traders. However, navigating its complexities can be daunting for those unfamiliar with the intricacies of this specialized field. Enter bar charts, the visual shorthand that provides a clear and comprehensive representation of market activity, empowering you to unravel the mysteries of options trading.
Understanding Options Trading
Options contracts offer a unique means of speculating on the future price movements of underlying assets, such as stocks, bonds, or currencies. Essentially, they grant the holder the right, but not the obligation, to buy (call option) or sell (put option) the underlying asset at a predetermined price (strike price) within a specified time frame (expiration date). Options trading allows investors to capitalize on both bullish and bearish market sentiments, hedge against potential losses, and enhance their portfolio returns.
Bar Charts: A Window into Market Dynamics
Bar charts have long been the mainstay of technical analysis, the art of deciphering market trends based on historical price data. Each bar represents a specific time interval, typically a day, week, or month, and consists of four key elements: the opening price, the highest price, the lowest price, and the closing price. This visual representation consolidates vast amounts of data, allowing traders to identify patterns, trends, and potential trading opportunities.
Using Bar Charts for Options Trading
Bar charts provide invaluable insights for options traders, enabling them to:
- Identify Trends: The general direction of the market is often discernible from the slope of the bar chart. Rising bars indicate an uptrend, while falling bars signal a downtrend. This information informs the choice of call or put options.
- Recognize Support and Resistance Levels: These are price points where the market has consistently bounced off or stalled. Identifying these levels can pinpoint potential reversal points or target prices for options strategies.
- Spot Volume and Volatility: The volume and volatility associated with each bar provide clues about market sentiment and the likelihood of future price movements. High volume and volatility tend to indicate increased uncertainty and potential trading opportunities.
- Formulate Trading Strategies: Armed with the insights gleaned from bar charts, traders can develop and execute effective options trading strategies, such as buying calls at support levels or selling puts at resistance levels.
Expert Perspectives
“Bar charts are the foundation of my options trading decisions,” observes financial analyst Mark Douglas. “They provide me with a clear picture of market dynamics, allowing me to anticipate price movements and make informed trades.”
“Integrating volume and volatility analysis into your bar chart reading further enhances its utility,” adds options trader John Carter. “This combination provides a comprehensive view of market activity, helping me identify high-probability trading opportunities.”
Conclusion
Options trading with bar charts empowers investors and traders with a potent tool for navigating the financial markets. By deciphering the patterns and trends revealed by bar charts, you gain a competitive edge in identifying trading opportunities, executing strategic trades, and unlocking the potential for substantial returns. Embrace the power of bar charts and elevate your options trading to new heights.

Image: www.warriortrading.com
Options Trading With Bar Charts
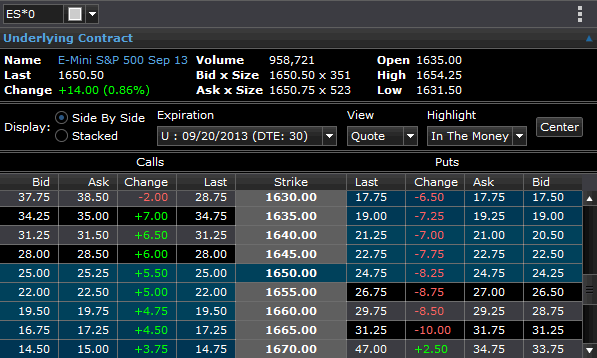
Image: www.barchart.com


