


Introduction

Image: www.schwab.com
Have you ever wondered how to gauge the momentum and interest behind an options contract? The answer lies in options trading volume, a crucial indicator that reveals the number of contracts traded over a specific period. Understanding how to track and interpret this data can give you an edge in options trading, allowing you to identify potential opportunities and make informed decisions.
Understanding Options Trading Volume
Options trading volume measures the total number of options contracts that have been bought or sold within a given time frame, typically a trading day. It is a key indicator of market sentiment and trading activity, providing valuable insights into the underlying asset’s price direction and volatility.
When volume is high, it suggests strong interest and activity in the options market. This can indicate that a significant price move is anticipated, either bullish or bearish. Conversely, low volume may indicate a lack of interest or uncertainty, suggesting that the market is uncertain about the asset’s future direction.
Where to Find Options Trading Volume
Options trading volume data can be readily accessed through a variety of platforms, including brokerage websites and financial news outlets.
Brokerage Websites
Most online brokerages provide trading volume information alongside options quotes. Simply select the desired options contract and look for the “Volume” or “Volume Today” field.
Financial News Outlets
Reputable financial news outlets, such as CNBC, Bloomberg, and Yahoo Finance, often report options trading volume data in their market coverage. Search for the specific options contract you are interested in and find the latest volume information.
Interpreting Options Trading Volume
When interpreting options trading volume, consider the following factors:
Absolute Volume
The absolute volume represents the total number of contracts traded. High volume suggests strong activity and potential market movements, while low volume may indicate uncertainty or a lack of interest.
Relative Volume
Relative volume compares the current volume to the average volume over a specific period, such as the previous day or month. A significant increase in relative volume can indicate a notable shift in market sentiment.
Volume Profile
A volume profile provides a graphical representation of the volume traded at different price levels. It can reveal areas of support and resistance, as well as potential breakout points.
Context and News Events
Always consider the broader market context and recent news events when interpreting volume data. Significant market events, such as earnings announcements or economic data releases, can influence volume and price movements.
Conclusion
Mastering the art of tracking and interpreting options trading volume is a powerful tool for options traders. By understanding the insights it provides, you can make more informed trading decisions, identify potential opportunities, and gauge market sentiment. Remember to conduct thorough research, consider the broader market context, and always trade responsibly.
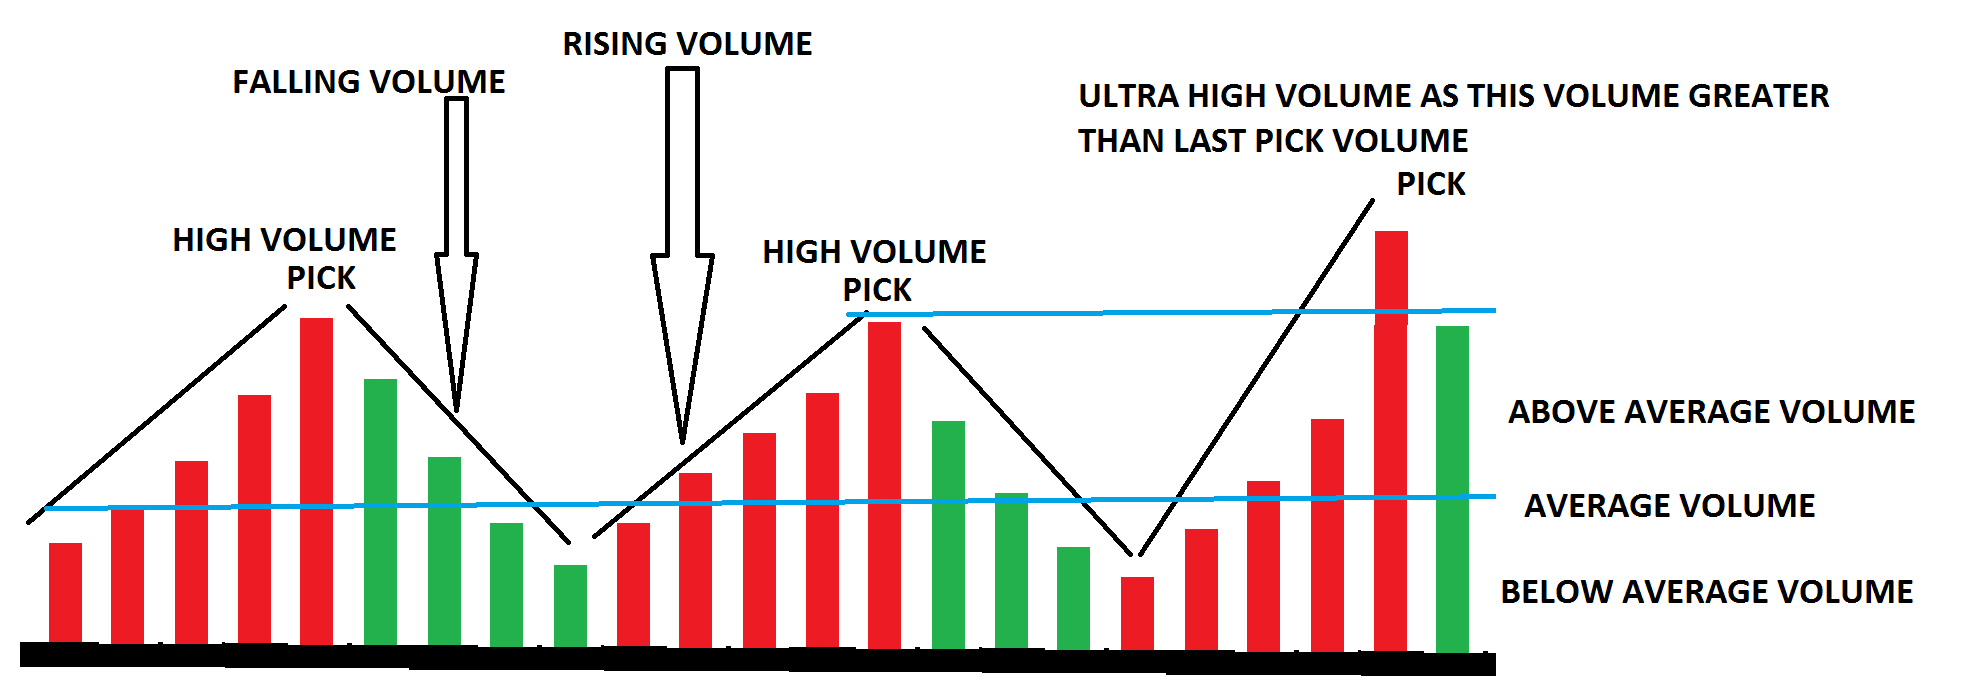
Image: dotnettutorials.net
How To See Options Trading Volume
:max_bytes(150000):strip_icc()/dotdash_final_Price_by_Volume_Chart_PBV_Dec_2020-01-fa603cf762884966b3011aab59426e24.jpg)
Image: ar.inspiredpencil.com


