


Have you ever felt like embarking on a financial expedition into the enigmatic realm of options trading, only to be met with a labyrinth of charts and graphs that seem as incomprehensible as an ancient hieroglyphic? If so, this comprehensive guide will unravel the complexities of options trading charts, equipping you with the knowledge to interpret their secrets and make informed investment decisions.

Image: mungfali.com
Understanding the Landscape: Options Trading Charts
Options trading charts, like the EKGs of the financial markets, provide a visual representation of the historical price movements and trading activity of an underlying asset. They are an indispensable tool for options traders, offering insights into market sentiment, volatility patterns, and potential trading opportunities. Understanding how to decipher these charts is akin to unlocking the Rosetta Stone of options trading success.
Charting a Course: Key Elements of an Options Trading Chart
The anatomy of an options trading chart encompasses several critical components:
- Time Axis: The horizontal axis typically represents the time frame, ranging from intraday (minute-by-minute) to monthly or longer-term time scales.
- Price Axis: The vertical axis displays the price of the underlying asset or the option premium.
- Candlesticks: These vertical bars represent a specific time period and depict the open, high, low, and closing prices within that interval. Color-coding can indicate price changes (e.g., green for rising prices, red for declining prices).
- Volume: The number of contracts traded during a specific period is often plotted below the price action, providing an indication of market activity.
- Indicators and Overlays: Traders often employ technical analysis tools, such as moving averages, Bollinger Bands, and stochastic oscillators, to identify trends and predict future price movements. These indicators can be displayed as overlays on the chart, adding depth to the analysis.
Deciphering the Patterns: Chart Patterns and Their Significance
Options trading charts exhibit a range of patterns, each with its own unique implications for traders. Some common pattern types include:
- Trendlines: These diagonal lines connect a series of consecutive higher or lower prices, indicating the overall trend of the market.
- Support and Resistance Levels: Support levels mark areas where prices tend to bounce back higher, while resistance levels indicate levels where prices struggle to break through.
- Triangles: Symmetry-defined patterns formed by a series of converging trendlines can signal breakout opportunities or consolidations.
- Head and Shoulders: This reversal pattern consists of a central peak (head) flanked by two smaller peaks (shoulders), indicating a potential change in the market trend.
- Flags and Pennants: These consolidation patterns resemble triangles and can signal a continuation of the prevailing trend upon breakout.
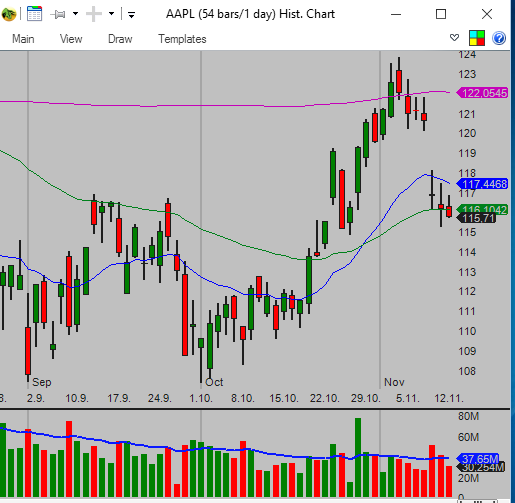
Image: osminosan.blogspot.com
Embracing Volatility: Implied Volatility and the Greek Letters
Implied volatility, measured through options pricing models, quantifies the market’s expectation of future price volatility. It plays a crucial role in options trading as higher implied volatility leads to higher option premiums. Additionally, understanding the “Greeks,” a set of metrics (e.g., Delta, Gamma, Theta), is paramount for assessing the risk and sensitivity of options positions to changes in underlying price, time, and other factors.
How To Read Options Trading Charts
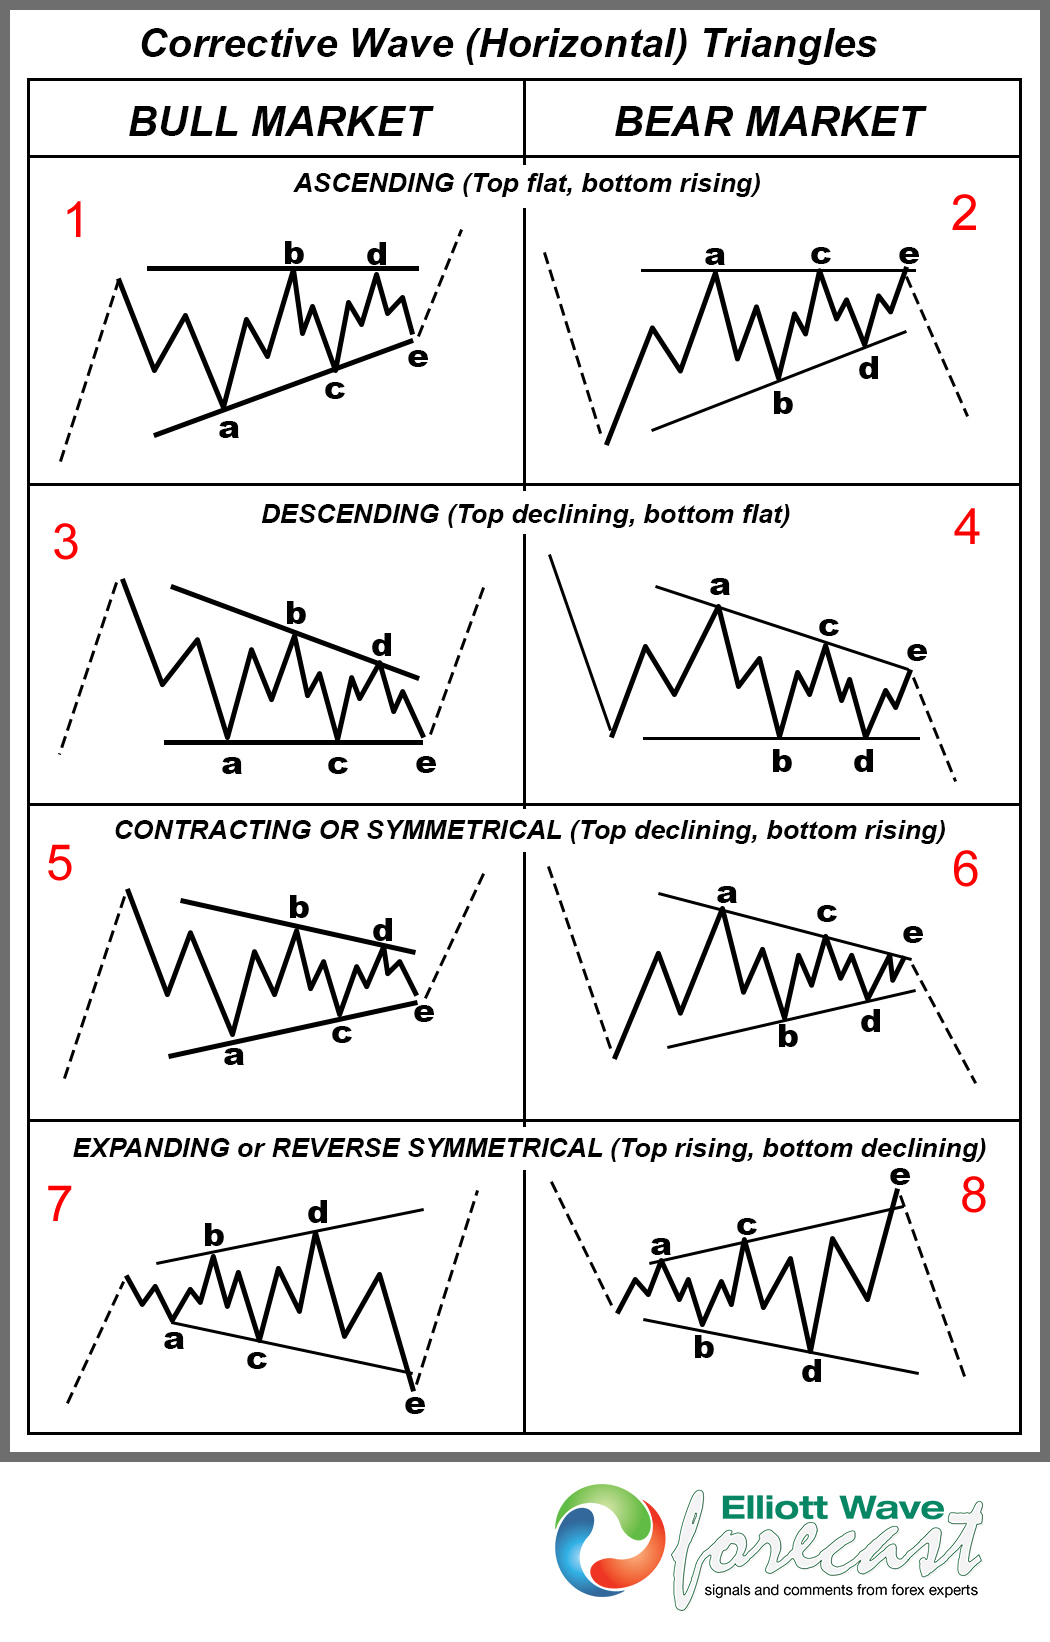
Image: design.udlvirtual.edu.pe
Conclusion: Unlocking the Treasures of Options Trading Charts
Navigating the intricacies of options trading charts can be an empowering experience, opening up a world of financial opportunities. By mastering the art of chart interpretation, traders can refine their decision-making, anticipate market direction, and optimize their trading strategies. Remember, the key to unlocking the treasures of options trading lies in embracing the discipline of technical analysis and continuously expanding your knowledge in this dynamic and ever-evolving field.


