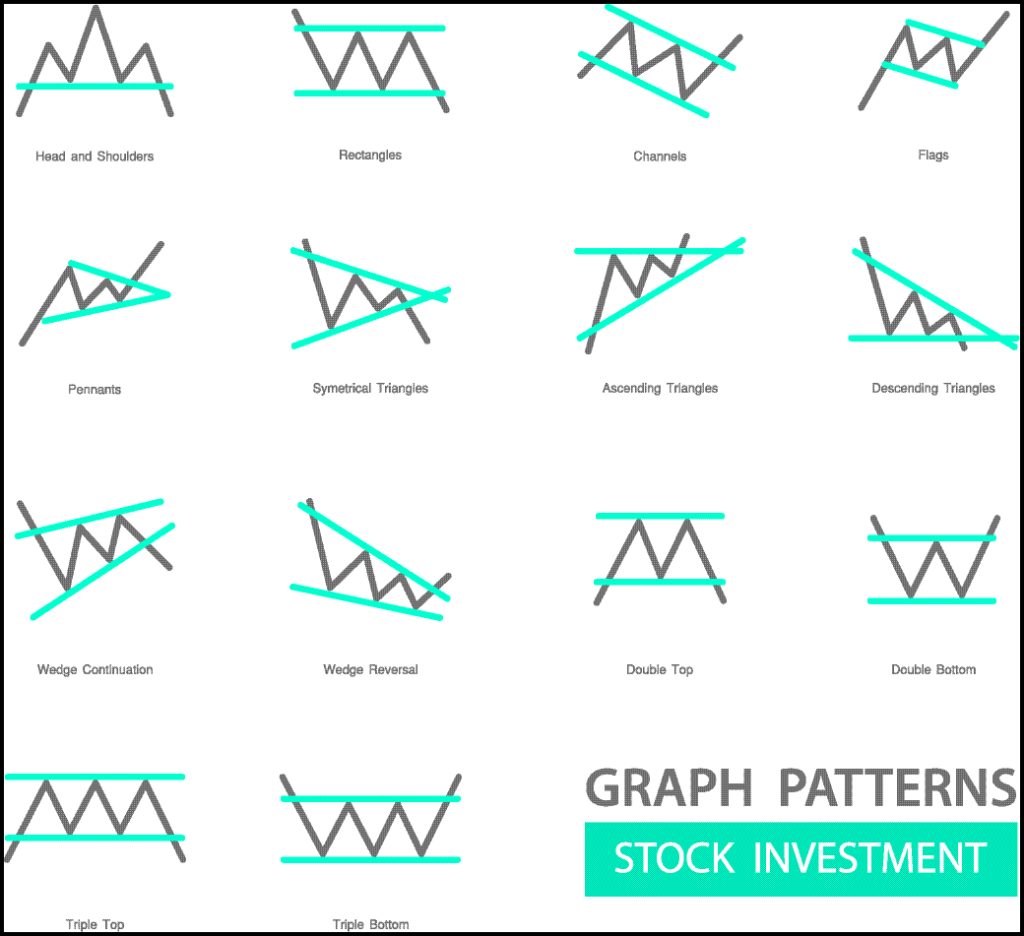
In the ever-evolving world of financial markets, traders are constantly seeking an edge to make informed decisions and maximize their returns. Enter technical analysis, a powerful tool that harnesses historical price data to uncover patterns and predict future market movements. When applied to option trading, technical analysis can empower traders with a data-driven understanding of the underlying asset’s trajectory, enabling them to make strategic trades with increased confidence.

Image: hitandruncandlesticks.com
Technical analysis is rooted in the belief that market behavior follows discernible patterns that can be identified and capitalized upon. By studying charts and graphs, traders can analyze price trends, support and resistance levels, and various indicators to gain insights into the supply and demand dynamics driving the market.
Among the fundamental concepts of technical analysis is trend identification. By observing the overall direction of the market, traders can determine its current bias. Uptrends indicate a higher propensity for prices to move upward, while downtrends suggest a downward bias. Identifying trends helps traders align their trades with the market’s momentum, increasing their likelihood of success.
Support and resistance levels are another crucial aspect of technical analysis. Support levels represent price points where buyers tend to step in to prevent further price declines, while resistance levels indicate areas where sellers may become active and push prices lower. Identifying these levels allows traders to establish optimal entry and exit points, maximizing their profit potential while minimizing risk.
Technical indicators are mathematical tools that transform raw price data into more accessible and interpretable information. These indicators can range from simple moving averages that smooth out price fluctuations to more complex oscillators that measure market momentum. By overlaying indicators on price charts, traders can identify overbought or oversold conditions, potential reversal points, and trend strength.
Moving beyond theory, let’s explore how technical analysis can be applied in real-world option trading. For instance, consider a trader who believes the stock market is in an uptrend. Using technical analysis, they might identify a stock that is trading above its support level and exhibiting bullish momentum through rising moving averages. The trader could then purchase call options on this stock, anticipating its continued appreciation.
Alternatively, if a trader anticipates a market downturn, they might use technical analysis to locate a stock that has broken below its support level and is showing signs of weakness. In this case, the trader could sell put options, profiting from the expected price decline.
Of course, technical analysis is not a foolproof method, and it should be used in conjunction with other trading strategies. It is essential to remember that historical price patterns do not guarantee future performance, and unexpected events can always impact the market.
To enhance the reliability of technical analysis, traders should consult multiple indicators and time frames, seeking convergence to increase confidence in their trading decisions. Additionally, it is crucial to understand the limitations of technical analysis and avoid relying solely on this method.
In the hands of a skilled trader, technical analysis can be a formidable weapon in the arsenal of option trading. By harnessing the power of historical data and identifying patterns, traders can gain a deeper understanding of market behavior and make more informed decisions, increasing their chances of profitability in the ever-changing and dynamic financial landscape.

Image: www.pinterest.com
Technical Analysis In Option Trading
https://youtube.com/watch?v=-HnMeQnV4h8


