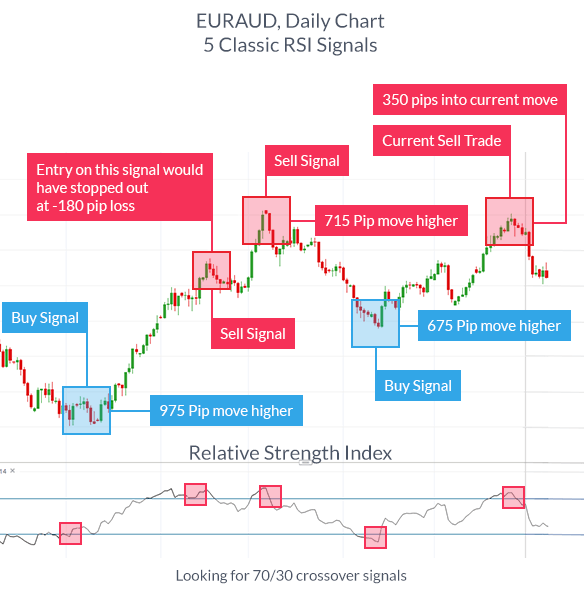
Navigating the labyrinthine world of options trading requires a keen eye for indicators that can provide valuable insights into market trends. Options trading indicators, like guiding stars in the financial cosmos, illuminate potential opportunities, flag potential risks, and help traders make informed decisions. In this comprehensive guide, we will delve into the best options trading indicators, unravel their intricacies, and explore how they can elevate your trading strategies.

Image: nebash.com
Understanding Options Trading Indicators
Options trading indicators are mathematical tools that analyze historical and real-time data to identify patterns, measure volatility, and forecast future price movements of underlying assets. They are indispensable for options traders as they provide objective and quantifiable data that can complement subjective analysis and enhance trading decisions. Indicators can be classified into two broad categories: technical indicators and fundamental indicators.
Technical indicators rely solely on historical price data, such as closing prices, volumes, and moving averages. They seek to uncover actionable trading signals by identifying trends, overbought and oversold conditions, and support and resistance levels. Some of the most popular technical indicators include the Relative Strength Index (RSI), the Moving Average Convergence Divergence (MACD), and Bollinger Bands.
Fundamental indicators, on the other hand, incorporate economic and financial data, such as earnings per share, dividend yield, and interest rates, into their calculations. They assess the intrinsic value of an underlying asset and gauge its potential for long-term growth. Key fundamental indicators include the Price-to-Earnings (P/E) ratio, the Price-to-Book (P/B) ratio, and the dividend payout ratio.
Intraday Options Trading Indicators for Short-Term Trades
For traders seeking to profit from short-term price fluctuations, intraday options trading indicators are essential companions. These indicators focus on analyzing price movements within a single trading day to identify scalping opportunities and capitalize on market volatility. Some effective intraday options trading indicators include:
- Ichimoku Cloud: This comprehensive indicator combines multiple technical indicators into a single visual representation, providing insights into trend direction, support, and resistance levels.
- Stochastics Oscillator: This indicator measures the momentum of an underlying asset by comparing its closing price to its high and low range over a specified period.
- Williams’ %R: This oscillator identifies overbought and oversold conditions by comparing an asset’s closing price to its highest high and lowest low over a specific period.
Long-Term Options Trading Indicators for Strategic Investments
For options traders with a longer-term perspective, strategic indicators provide a roadmap to identify potential investment opportunities and manage risks. These indicators consider broader market trends, economic conditions, and historical data to assess the potential for sustained growth or decline in an underlying asset. Key long-term options trading indicators include:
- Historical Volatility Index (HVIX): This indicator gauges the market’s expectation of future volatility by measuring the implied volatility of S&P 500 options.
- Commodity Channel Index (CCI): This indicator measures the strength of an underlying asset’s price movement relative to its historical volatility.
- Moving Average Convergence Divergence (MACD): This indicator identifies trends and divergences by measuring the difference between two moving averages, providing insights into potential trend reversals.

Image: www.andrewstradingchannel.com
Risk Management Indicators for Prudent Trading
Managing risk is paramount in options trading, and indicators can play a crucial role by flagging potential hazards and providing risk-adjusted trading strategies. Some essential risk management indicators include:
- Volatility Index (VIX): This indicator measures the market’s perception of volatility by tracking the implied volatility of S&P 500 options. It can help traders gauge the potential risks associated with specific trades.
- Risk/Reward Ratio: This indicator calculates the potential reward from a trade relative to the potential risk, providing insights into the potential trade-off between profit and loss.
- VaR (Value at Risk): This indicator quantifies the potential financial loss that can be incurred from a specific trade, given a specified confidence level.
Best Options Trading Indicators
Conclusion
Options trading indicators empower traders with actionable insights, helping them make informed decisions, mitigate risks, and capitalize on market opportunities. From technical indicators that identify short-term trends to fundamental indicators that assess intrinsic value and long-term growth potential, indicators provide a robust toolkit for options traders of all levels. Understanding, interpreting, and applying these indicators effectively can significantly enhance trading strategies and open the door to greater profits and reduced risks.


