


In the fast-paced realm of option trading, navigating the volatile market landscape requires a sharp eye and a keen understanding of technical analysis tools. Amidst the myriad of indicators at your disposal, candlestick signals stand out as a powerful visual representation of price action, offering valuable insights into market momentum and potential reversals.

Image: www.warriortrading.com
Candlesticks, with their wick-like structure, encapsulate the essence of every trading interval, depicting the open, high, low, and close prices of an underlying security. By interpreting their unique patterns and formations, traders can glean valuable information about the market’s past and potential future movements.
Like pieces of a puzzle, candlestick signals combine to reveal a comprehensive picture of market sentiment and price behavior. From bullish hammers to bearish hanging men, each formation carries a distinct meaning, guiding traders towards informed trading decisions. Let’s delve into the fascinating world of option trading candlestick signals, empowering you with the knowledge to navigate the market with confidence.
The Evolution of Candlestick Signals: From Humble Origins to Analytical Prowess
Candlestick signals have their roots in 18th-century Japan, where rice traders employed them to capture the intricacies of the market. Over time, these visual representations of price action spread westward, gaining widespread adoption among technical analysts worldwide. Today, candlestick signals serve as indispensable tools for traders seeking to decode market movements and maximize their trading efficiency.
Bullish Candlestick Signals: Spotting Opportunities for Market Ascension
Bullish candlestick signals indicate upward price momentum and provide traders with early indications of potential buy opportunities. Let’s explore some of the most prominent bullish formations:
-
Hammer: Shaped like an inverted “T,” the hammer suggests a reversal of a downtrend. The small body rests at the bottom of the candle, while a long lower wick signals buyers’ determination to push prices higher.
-
Bullish Engulfing: A testament to strong buying pressure, the bullish engulfing pattern consists of a red candle followed by a green candle that completely “engulfs” the previous candle’s range, indicating a shift in market sentiment.
-
Morning Star: This three-candle formation represents a bullish reversal after a downtrend. A long red candle is followed by a small-bodied candle with a higher close, and finally, a green candle that closes above the first candle’s high.
Bearish Candlestick Signals: Navigating Market Downturns with Precision
Bearish candlestick signals, on the other hand, alert traders to potential downtrends or reversals of an uptrend. By recognizing these patterns, traders can proactively adjust their strategies:
-
Hanging Man: Similar to the bullish hammer but inverted, the hanging man signal consists of a small upper body and a long lower wick. It suggests a potential reversal of an uptrend, as sellers are gaining momentum.
-
Bearish Engulfing: The opposite of the bullish engulfing pattern, the bearish engulfing pattern occurs when a green candle is followed by a red candle that completely “engulfs” the previous candle’s range, signaling a shift towards bearish sentiment.
-
Evening Star: This three-candle formation indicates a reversal of an uptrend. A long green candle is followed by a small-bodied candle with a lower close, and finally, a red candle that closes below the first candle’s low.
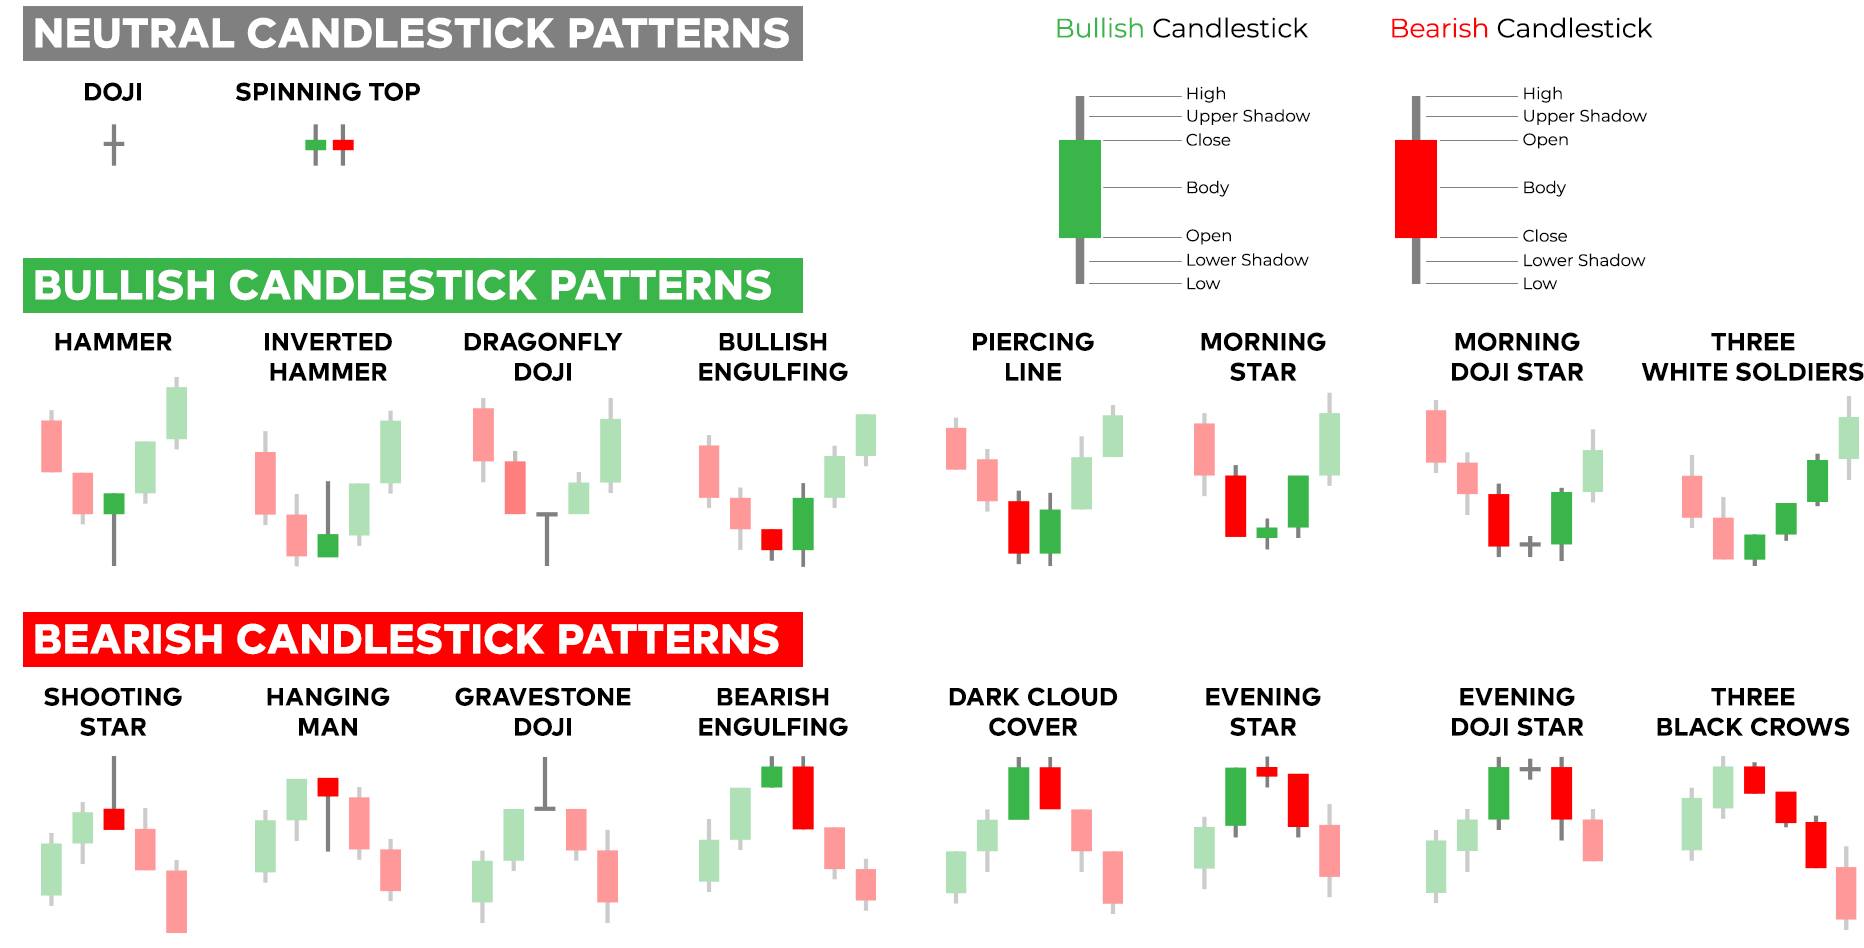
Image: app.jerawatcinta.com
Expert Insights: Unleashing the Power of Candlestick Analysis
To enhance your mastery of candlestick signals, seek guidance from seasoned experts in the field. Their insights offer valuable perspectives based on years of experience analyzing market movements:
-
“Candlestick patterns provide visual cues that allow traders to identify potential trading opportunities,” says renowned technical analyst Steve Nison. He emphasizes the importance of considering candlestick signals within the context of broader market conditions.
-
Technical analysis legend John Bollinger suggests combining candlestick signals with other technical tools for comprehensive market analysis. He advises traders to “look for multiple pieces of evidence before making a trading decision based solely on candlestick patterns.”
Practical Tips: Empowering Informed Trading Decisions
Elevate your trading strategy by incorporating the following actionable tips:
-
Combine Multiple Signals: Don’t rely solely on a single candlestick signal. Combine different formations to enhance your analysis and increase confidence in your trading decisions.
-
Consider Market Context: Assess candlestick signals in conjunction with other market factors, such as price trends, volume, and macroeconomic news.
-
Manage Risk: Utilize stop-loss orders and position sizing strategies to mitigate potential losses, ensuring your trading activities remain within acceptable risk parameters.
Option Trading Candlestick Signals
Conclusion: Empowering Traders with the Art of Candlestick Analysis
Mastering option trading candlestick signals is a transformative skill that empowers traders to navigate the dynamic market landscape with confidence and precision. By recognizing and interpreting these visual representations of price action, you gain a competitive edge, unlocking the ability to identify potential trading opportunities and make informed decisions.
Remember, technical analysis, including candlestick signals, provides valuable insights into market behavior, but it is not a crystal ball. Embrace continuous learning, seek expert guidance, and always trade responsibly within your risk tolerance. As you delve deeper into the world of candlestick signals, you’ll discover the immense power of visual patterns in shaping your trading journey.


