


Introduction
Mastering the art of options trading requires a deep understanding of market trends and the ability to predict future price movements. Technical indicators are essential tools that empower traders to analyze price action, identify trading opportunities, and make informed decisions. In this comprehensive guide, we delve into the world of technical indicators, exploring the top indicators for options trading, and empowering you with the knowledge to navigate the complexities of the options market.
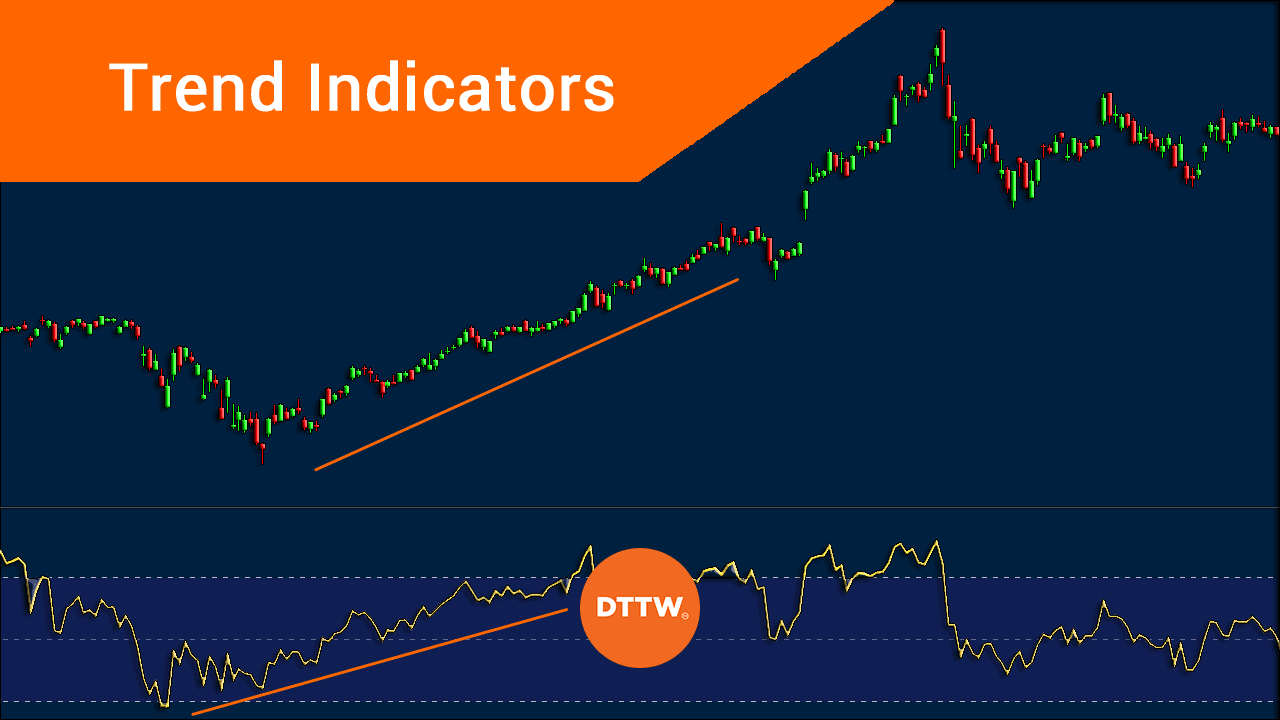
Image: www.daytradetheworld.com
Traders rely on technical indicators to gain insights into market sentiment, predict price direction, and make data-driven trading decisions. These indicators provide a graphical representation of past and current price movements, highlighting patterns and trends that help traders anticipate future price behavior. Embracing technical indicators empowers traders to identify overbought or oversold conditions, gauge market momentum, and recognize potential trading opportunities.
Relative Strength Index (RSI)
The Relative Strength Index (RSI) is a momentum oscillator that measures the magnitude of recent price changes to assess whether an asset is overbought or oversold. RSI oscillates between 0 and 100, with values above 70 indicating overbought conditions and values below 30 indicating oversold conditions. Traders use RSI to identify potential trend reversals and trading opportunities.
Moving Averages (MAs)
Moving Averages (MAs) smooth out price fluctuations to reveal underlying trends. They are calculated by averaging closing prices over a specific period, with common MAs including the 50-day, 100-day, and 200-day MAs. Traders use MAs to identify support and resistance levels, confirm trends, and make trading decisions.
Bollinger Bands (BBs)
Bollinger Bands (BBs) consist of three lines: a simple moving average (SMA) and two standard deviation bands above and below the SMA. BBs help traders identify volatility and potential trading opportunities. When the bands are wide, it indicates high volatility, and when the bands are narrow, it indicates low volatility. Traders use BBs to identify potential breakouts and reversals.
:max_bytes(150000):strip_icc()/dotdash_Final_The_Top_Technical_Indicators_for_Options_Trading_Oct_2020-02-42c4759d04404c5581ac71091f7c8a0e.jpg)
Image: www.investopedia.com
Volume
Volume measures the number of contracts traded over a specific period. High volume typically indicates increased market participation and can be used to confirm trend strength. Traders use volume to gauge market sentiment and identify potential trading opportunities.
Stochastic Oscillator
The Stochastic Oscillator compares the closing price of an asset to its trading range over a specific period. It oscillates between 0 and 100, with values above 80 indicating overbought conditions and values below 20 indicating oversold conditions. Traders use the Stochastic Oscillator to identify potential trend reversals.
Ichimoku Cloud
The Ichimoku Cloud is a comprehensive technical indicator that combines multiple lines and indicators to provide insights into trend direction, momentum, and support and resistance levels. It consists of the Tenkan-sen, Kijun-sen, Senkou Span A, Senkou Span B, and the Chikou Span. Traders use the Ichimoku Cloud to identify potential trading opportunities and make informed trading decisions.
MacD (Moving Average Convergence Divergence)
The MacD (Moving Average Convergence Divergence) is a trend-following momentum indicator that measures the relationship between two exponential moving averages (EMAs). It consists of the MacD line, the signal line, and the histogram. Traders use the MacD to identify trend reversals, momentum, and potential trading opportunities.
Exponential Moving Average (EMA)
The Exponential Moving Average (EMA) is a type of moving average that gives more weight to recent price changes. It is calculated by applying a smoothing factor to the closing prices, with a higher smoothing factor resulting in a faster EMA. Traders use EMAs to identify trends, confirm price breakouts, and make trading decisions.
Fibonacci retracement
Fibonacci retracement levels are horizontal lines drawn at key Fibonacci ratios (e.g., 23.6%, 38.2%, 50%, 61.8%, and 100%). These levels are used to identify potential support and resistance levels and predict price retracements or extensions. Traders use Fibonacci retracement levels to identify potential trading opportunities and make informed trading decisions.
Top Technical Indicators For Options Trading
/dotdash_Final_Top_Technical_Indicators_for_Rookie_Traders_Sep_2020-01-65454aefbc9042ef98df266def257fa3.jpg)
Image: www.incomementorbox.com
Conclusion
Technical indicators are indispensable tools for options traders, providing valuable insights into market trends and price movements. By understanding and applying these indicators effectively, traders can make informed decisions, identify trading opportunities, and improve their overall trading performance. The indicators discussed in this guide represent a comprehensive arsenal for options traders, empowering them to navigate the complexities of the options market and enhance their trading strategies. Embrace the power of technical indicators and unlock the secrets of successful options trading.


