Introduction
Options trading is a powerful tool for investors and traders in India, offering the potential for substantial returns. However, it’s also a complex and risky strategy, and selecting the right indicators is crucial to maximizing your chances of success. In this article, we will delve into the world of technical indicators and identify the most effective ones for option trading in the Indian market.

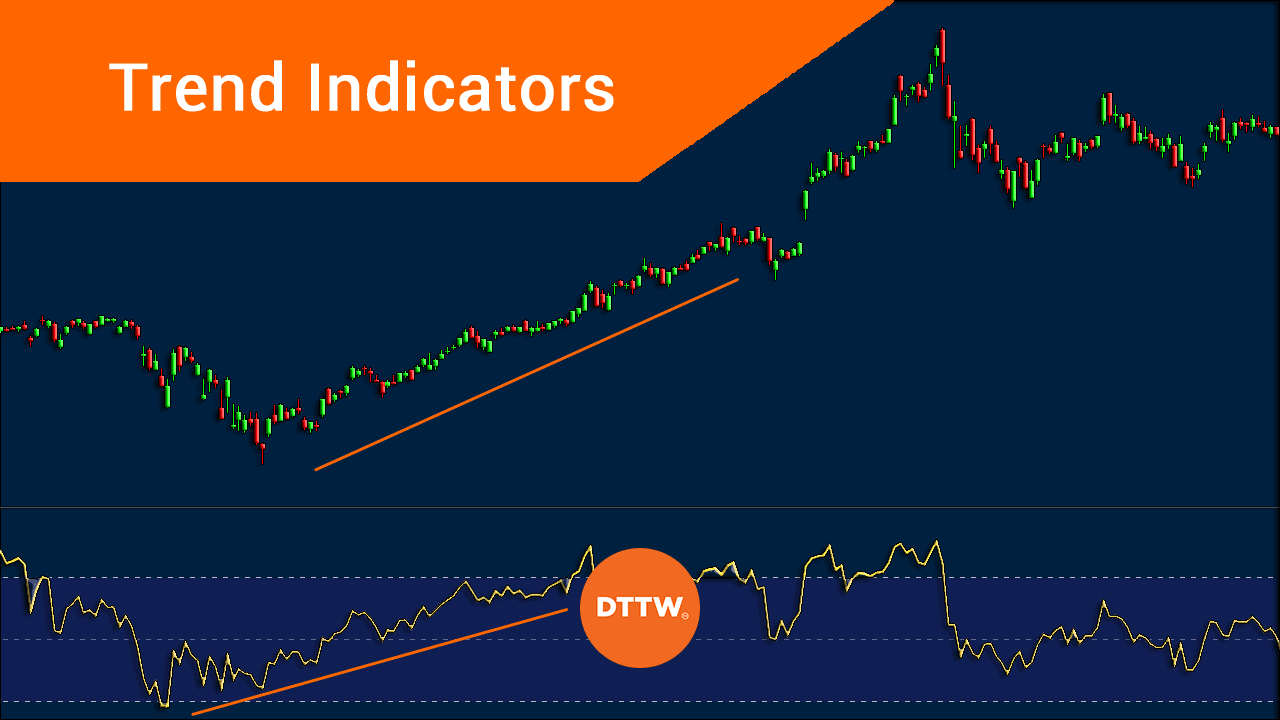
Image: www.daytradetheworld.com
Technical indicators are mathematical calculations based on historical price data that help traders identify trading opportunities. They aid in predicting future price movements by highlighting trends, support and resistance levels, and other important market dynamics.
RSI (Relative Strength Index)
The RSI measures the relationship between gains and losses to quantify the strength of a trend. A reading above 70 indicates an overbought condition, while below 30 indicates oversold. RSI is effective in identifying both overbought and oversold conditions in underlying assets, providing valuable insights for option traders.
Stochastics Oscillator
The Stochastics Oscillator calculates the momentum and overbought/oversold conditions by comparing the performance of an asset to a range of previous highs and lows. It can be used to identify potential reversals in trend and, when combined with other indicators, can help traders fine-tune their entry and exit points.
Bollinger Bands
Bollinger Bands are a volatility-based indicator that depicts price action relative to a moving average. The outer bands represent key support and resistance levels, providing traders with an understanding of price movement volatility and potential breakout or breakdown points. Bollinger Bands are widely used in option trading to identify trading opportunities around these support and resistance levels.

Image: www.cashoverflow.in
Moving Averages
Moving Averages (MAs) smooth out price data by calculating the average price over a specified number of days. They serve as trend indicators and help traders identify support and resistance levels. Traders can use multiple moving averages with different time frames to identify both short-term and long-term trends.
Volume
Volume measures the number of shares traded in a given time period. High volume often indicates increased market activity and can be a sign of a market break or reversal. Volume should be considered in conjunction with price action to validate potential trading opportunities and anticipate price changes.
Chart Patterns
Chart patterns are recurring price formations that can indicate potential trend reversals or continuations. Popular chart patterns for option trading include head and shoulders, triangles, flags, and breakouts. Identifying these patterns on price charts can help traders anticipate market behavior and make informed trading decisions.
Best Indicators For Option Trading In India
Conclusion
Selecting the right indicators is essential for successful option trading in India. The indicators discussed above provide a powerful toolkit that, when used strategically, can help traders identify potential trading opportunities, manage risk, and maximize returns. Remember, it’s always advisable to thoroughly understand the technical concepts and limitations of indicators before applying them to your trading decisions.


