Introduction
In the ever-evolving financial landscape, options trading has emerged as a powerful tool for investors seeking both profit and protection. However, navigating the complex world of options requires a deep understanding of various indicators that can guide your strategies. This comprehensive guide will delve into the top indicators for options trading, empowering you with the knowledge and insights to make informed decisions and maximize your potential.

Image: riset.guru
Understanding Options Trading Indicators
Options trading involves granting the buyer the right, not the obligation, to buy (call option) or sell (put option) an underlying asset at a specified price (strike price) on a predefined date (expiration date). Indicators, in this context, are technical and fundamental analysis tools that help traders identify potential price trends, volatility levels, and market sentiment.
Technical Indicators
1. Bollinger Bands
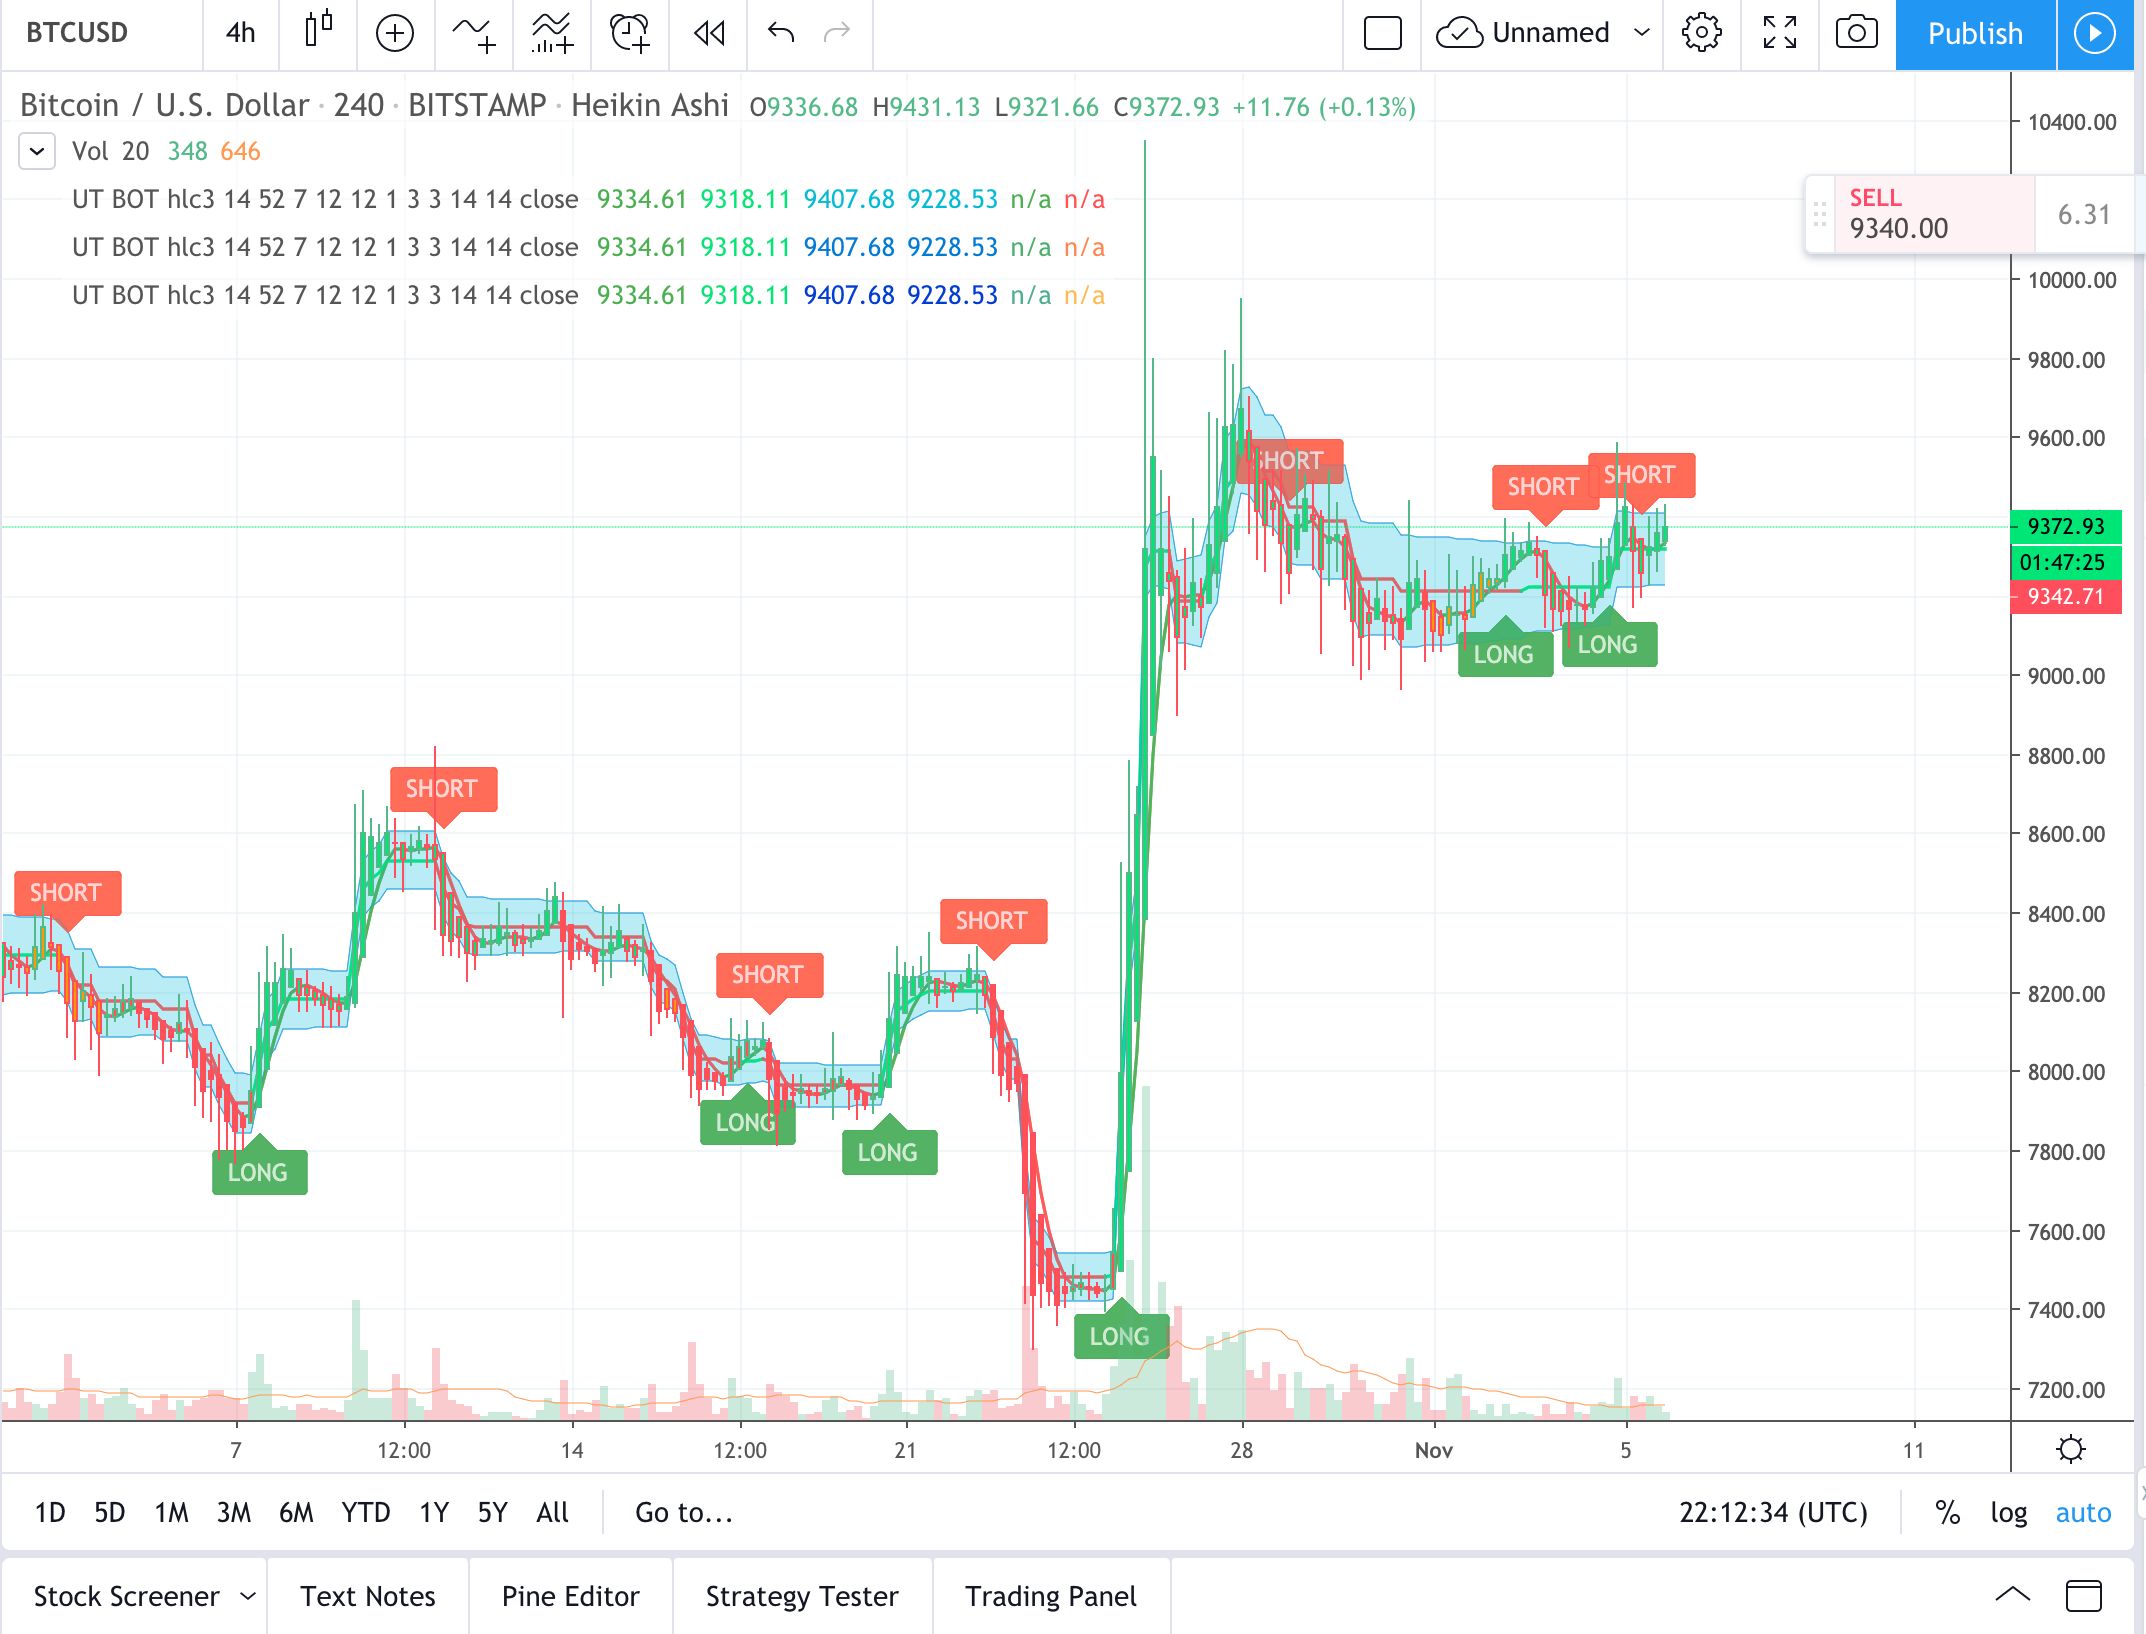
Bollinger Bands consist of a simple moving average (SMA) surrounded by two standard deviation bands above and below the average. They indicate market volatility and help identify potential overbought or oversold conditions.
Image: www.quora.com
2. Relative Strength Index (RSI)
The RSI measures the magnitude of price changes to determine whether an asset is overbought or oversold. It can also identify potential price reversals.
3. Moving Averages
Moving averages smooth out price data to eliminate random fluctuations. By analyzing the interactions between different moving averages (e.g., 50-day, 200-day), you can assess market trends and momentum.
4. Candlestick Patterns
Japanese candlestick charts provide visual representations of price action, allowing traders to identify specific patterns that indicate market sentiment and potential trading opportunities.
Fundamental Indicators
1. Earnings-Per-Share (EPS)
EPS represents a company’s earnings per outstanding share. It helps investors evaluate a company’s profitability and potential growth trajectory.
2. Price-to-Earnings (P/E) Ratio
The P/E ratio compares a company’s market value to its earnings. It provides insights into the company’s valuation and potential for growth or a decline.
3. Debt-to-Equity Ratio
This ratio measures a company’s financial leverage and ability to repay debt. A high debt-to-equity ratio can indicate financial risk.
Expert Insights and Actionable Tips
According to financial expert and best-selling author John Carter, “Successful options traders focus on identifying high-probability opportunities with clear risk definitions.” Incorporating technical and fundamental indicators into your analysis helps you quantify market movements and develop strategies with a higher potential for profitability.
Another industry legend, Mark Douglas, emphasizes the importance of emotional discipline in options trading. “Your most important wins happen in the mind,” he says. Manage your emotions and stick to your trading plan to make rational decisions without succumbing to fear or greed.
Top Indicators For Options Trading
https://youtube.com/watch?v=N-cpWJ6VtAE
Conclusion
Understanding and utilizing the top indicators for options trading is crucial for informed decision-making. By mastering technical indicators to assess market conditions and fundamental indicators to evaluate underlying values, you can develop a comprehensive strategy that aligns with your risk tolerance and investment goals.
Remember, knowledge is power, and this guide has equipped you with the necessary insights to elevate your options trading skills. Continue your learning journey, refine your strategies, and seize the opportunities this dynamic market presents. The world of options awaits your success!


