


# Options Trading Live Charts: A Real-Time Guide to Options Market Analysis
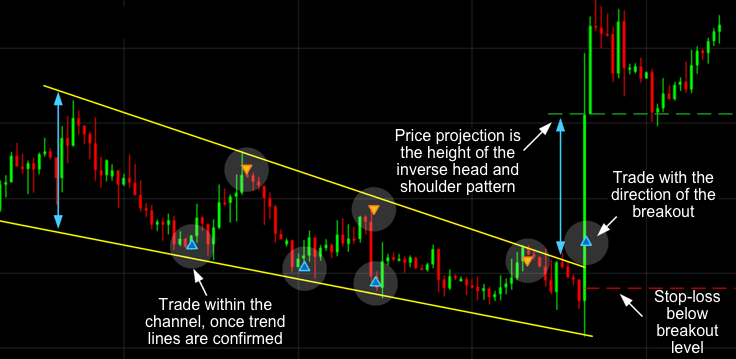
Image: www.cmcmarkets.com
Introduction:
In the dynamic world of options trading, every second counts. To succeed, traders need to harness the power of real-time data to make informed decisions and seize opportunities. Options trading live charts are an indispensable tool, providing traders with a window into the fast-paced options market, empowering them to analyze market trends, track price movements, and identify potential trading opportunities. By leveraging live charts, traders can make educated decisions and enhance their trading strategies.
What are Live Charts for Options Trading?
Live charts for options trading are interactive graphical representations that display real-time price data and market activity. These charts plot the price of a specific option against time, enabling traders to visualize the price changes over a defined period, such as a day, week, or month. The charts are highly customizable, allowing traders to select different options contracts, expirations, and view time frames that align with their trading strategies.
Benefits of Using Live Charts
Utilizing live charts offers numerous advantages for options traders:
-
Real-Time Market Visibility: Traders gain real-time insights into the options market, monitoring price movements, volatility, and option premiums as they fluctuate.
-
Trend Analysis: Live charts facilitate the identification of trends and patterns in the options market. By studying price movements, traders can anticipate market direction and make informed trading decisions.
-
Technical Analysis: Live charts allow traders to perform technical analysis by overlaying indicators, such as moving averages, support and resistance levels, and candlestick patterns. This enables them to identify potential trading opportunities and forecast future price movements.
-
Customized Views: Options trading live charts can be customized to suit individual trading styles and preferences. Traders can choose the underlying asset, expiration dates, and strike prices that best align with their trading strategies.
Key Elements of Live Charts
Understanding the key elements of live charts is crucial for effective trading:
-
Time Axis: The time axis along the bottom of the chart represents the time frame of the data being plotted, such as one day, one week, or one month.
-
Price Axis: The vertical axis of the chart shows the price of the option contract being tracked.
-
Bid and Ask Lines: These lines indicate the price at which a trader is willing to buy (bid) or sell (ask) an option contract.
-
Volume: This indicator shows the number of contracts that have been traded at a particular price point.
-
Indicators: Traders can overlay various technical indicators on live charts to analyze market trends, such as moving averages, Bollinger Bands, and Relative Strength Index (RSI).
Tips for Using Live Charts Effectively
-
Define Trading Strategy: Determine your trading strategy and identify the options contracts that align with it before using live charts.
-
Monitor Trends: Pay attention to long-term trends and identify reversals or breakouts that may indicate potential opportunities.
-
Technical Indicators: Utilize technical indicators as a tool for trend confirmation and signal generation, but do not rely solely on them.
-
Combine Indicators: Use multiple indicators together to provide a more comprehensive view of market behavior.
-
Manage Risk: Always consider the risks involved in options trading and implement appropriate risk management strategies.
Conclusion:
Options trading live charts are an invaluable tool for traders seeking to stay informed and make real-time trading decisions. By leveraging these charts, traders can gain deep insights into the options market, identify trends and patterns, and execute their trading strategies with confidence. Remember to use live charts in conjunction with other tools and techniques, such as fundamental analysis and risk management, to develop a well-rounded foundation for successful options trading. Harness the power of live charts and unlock the potential of real-time insights.
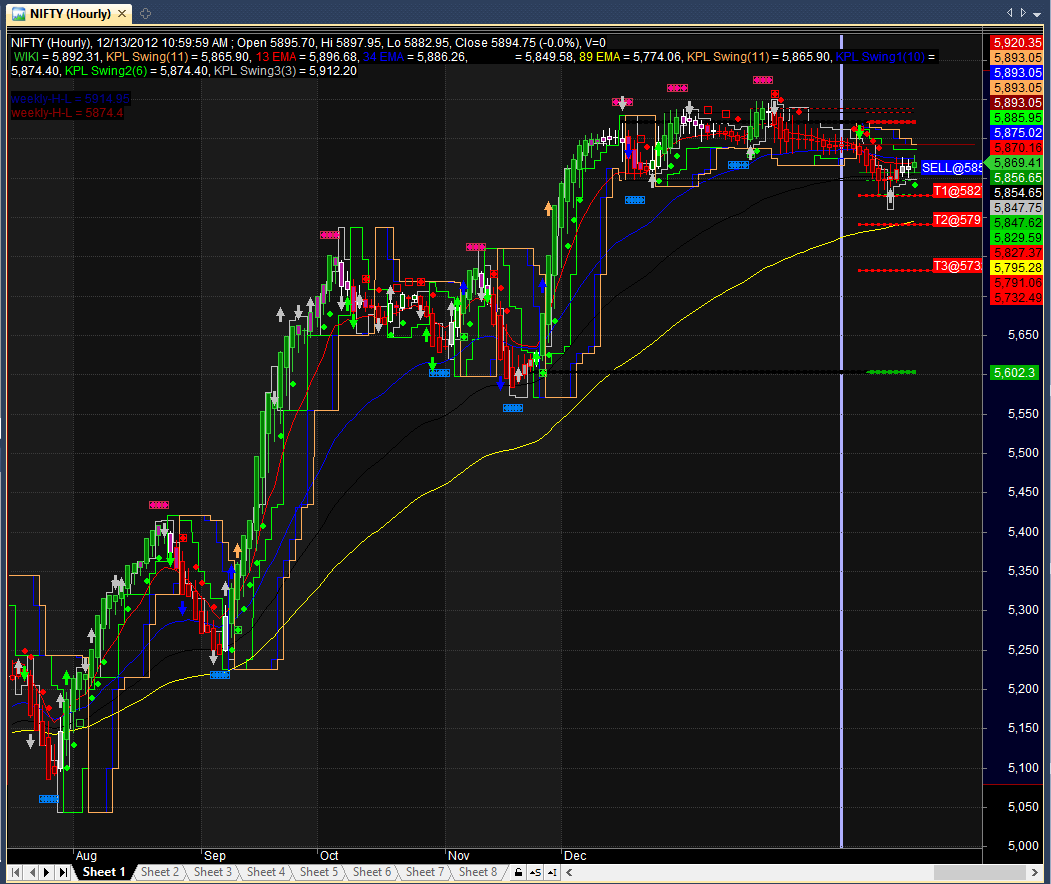
Image: kovivygoqabut.web.fc2.com
Options Trading Live Charts
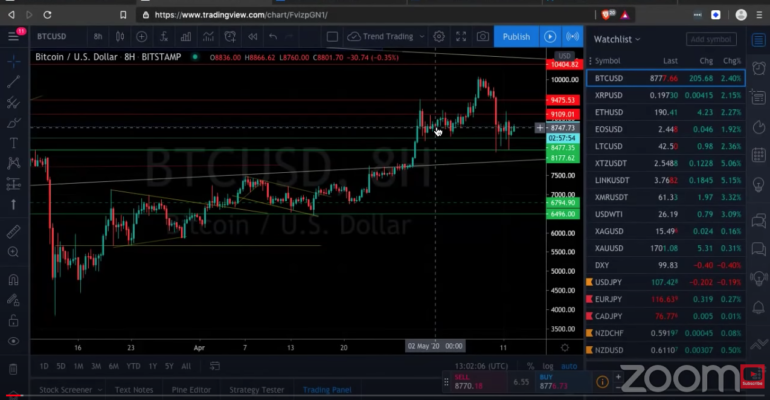
Image: www.conquertrades.com


