


As an avid trader, I’ve witnessed firsthand the importance of chart analysis in options trading. It empowers traders to make informed decisions, spot market trends, and identify potential trading opportunities.

Image: www.aiophotoz.com
Navigating the world of stock charts can seem daunting, but mastering these visual representations is crucial for successful options trading. In this comprehensive guide, we’ll delve into the art of chart reading, empowering you with the knowledge to decipher market movements like a pro.
Understanding Stock Charts
Stock charts are graphical representations of price fluctuations over time. They plot the opening, high, low, and closing prices of a stock at regular intervals, typically daily or intraday.
Each point on the chart represents a specific time and price. By connecting these points, charts form patterns that provide insights into market behavior. There are various chart types, including line, bar, and candlestick charts, each with its own unique characteristics.
Deciphering Chart Patterns
Chart patterns are recurring formations that indicate potential future price movements. Identifying these patterns can give traders an edge in predicting market direction.
Some common chart patterns include:
- Head and shoulders: Indicates a reversal of trend, typically from up to down.
- Double top: Signals a resistance level and a potential reversal to the downside.
- Triangle: Indicates consolidation and a potential breakout in either direction.
- Cup and handle: Signals a bullish trend and a potential continuation of the uptrend.
Technical Indicators for Chart Analysis
Technical indicators are mathematical calculations applied to stock prices that provide additional insights into market trends.
Some popular technical indicators include:
- Moving averages: Show the average price over a specified period, smoothing out short-term volatility.
- Relative Strength Index (RSI): Indicates overbought or oversold conditions.
- Bollinger Bands: Define a price range and identify potential trading opportunities.
- Stochastics: Measure the speed of price movement.
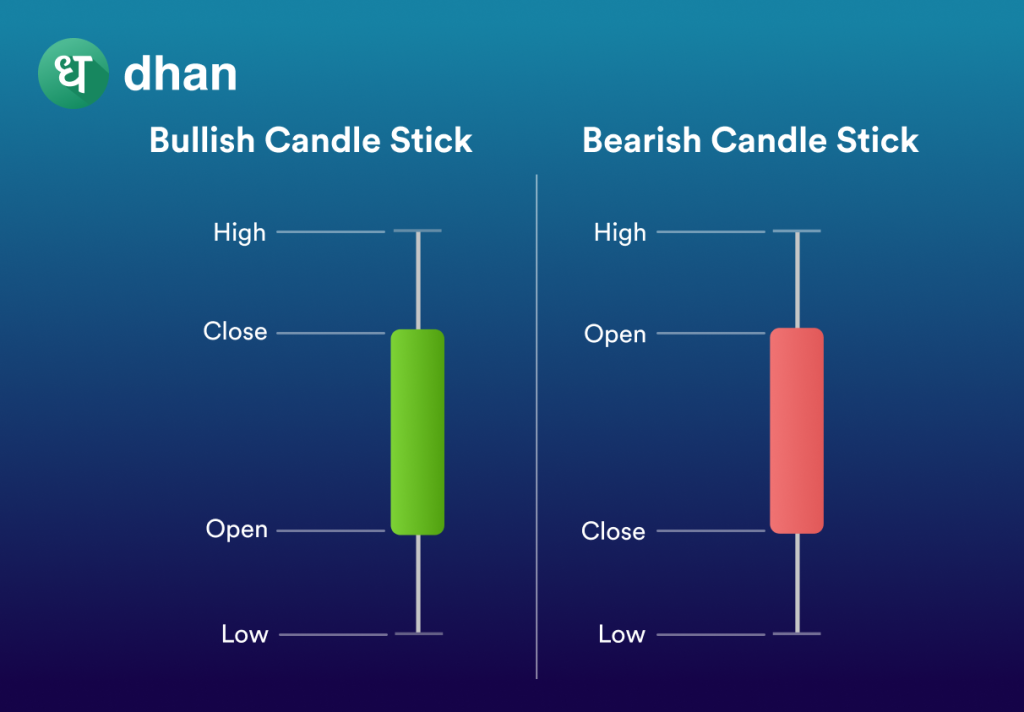
Image: blog.dhan.co
Expert Advice for Chart Reading
Here are some tips from seasoned traders:
- Combine chart patterns and technical indicators for a more comprehensive analysis.
- Use different time frames to identify long-term and short-term trends.
- Focus on consistency and practice to improve your accuracy.
- Stay up-to-date with market news and events that can influence stock prices.
Frequently Asked Questions about Stock Chart Reading
Q: What is the best type of chart for options trading?
A: Candle charts provide the most comprehensive information, showing the open, high, low, and close prices.
Q: How can I identify trading opportunities using stock charts?
A: Look for patterns that indicate a trend reversal or continuation. Technical indicators can also provide signals for potential trading opportunities.
How To Read Stock Charts For Options Trading

Image: maisiewood.z13.web.core.windows.net
Conclusion
Mastering the art of stock chart reading is essential for successful options trading. By understanding chart patterns, technical indicators, and expert advice, you can decipher market movements, make informed decisions, and maximize your trading potential.
Are you ready to delve deeper into the world of stock chart interpretation? Embark on this journey today and unlock the power of these visual representations for your options trading success.


