


In the ever-evolving world of financial markets, options trading has emerged as a powerful strategy for risk management and profit generation. Among the essential tools employed by options traders is chart analysis, a technique that scrutinizes price movements and patterns to predict future market behavior. By interpreting complex market data, traders can gain a competitive edge and enhance their investment decisions.

Image: www.pinterest.com
Navigating the Dynamics of Options Markets
Options trading introduces unique opportunities and complexities compared to traditional stock and bond markets. An option contract grants the buyer the right, but not the obligation, to buy or sell an underlying asset (stock, index, etc.) at a predetermined price (strike price) on or before a specific date (expiration date). This flexibility allows traders to speculate on future market movements while managing risk through defined premiums and potential profit caps.
The Art of Chart Analysis in Options Trading
Chart analysis serves as a visual representation of historical price data, enabling traders to identify trends, patterns, and potential reversal points. By studying candlestick charts, technical indicators, and support/resistance levels, traders can uncover meaningful insights into market sentiment and price behavior.
Candlestick charts display individual price action over a specified period, typically represented as days or weeks. The configuration of each candlestick (open, high, low, close) offers clues about buying and selling pressure, market momentum, and potential turning points.
Technical indicators, such as moving averages and Relative Strength Index (RSI), provide additional context by quantifying price action and identifying overbought or oversold conditions. Traders can customize these indicators to suit their trading style and the characteristics of the market they are analyzing.
Support and resistance levels delineate crucial price points where market momentum often pauses or reverses. Identifying these levels helps traders gauge the extent of potential price swings and adjust their strategies accordingly.
Empowering Traders with Actionable Insights
Mastering options trading chart analysis empowers traders to:
- Predict future price movements with greater accuracy, enabling them to enter and exit trades at optimal times.
- Manage risk effectively by identifying areas of potential volatility and support/resistance.
- Enhance their trading strategies by incorporating data-driven insights from chart analysis.
- Gain a competitive advantage in the fast-paced options market by leveraging technical expertise.
Key Considerations for Chart Analysis Success
While chart analysis is a valuable tool, it is crucial to note that it does not guarantee future market outcomes. Traders must exercise caution by:
- Understanding the limitations of chart analysis and employing it as a supplementary tool alongside fundamental analysis.
- Utilizing multiple time frames to gain a broader market perspective and avoid overfitting.
- Avoiding emotional decision-making and adhering to a disciplined trading plan.
- Continuously updating their knowledge of market dynamics and refining their chart analysis techniques.
Unlocking Market Potential with Chart Analysis
Chart analysis is a versatile technique that empowers options traders with actionable insights. By meticulously studying price movements and patterns, traders can navigate the complexities of options markets, mitigate risk, and enhance their profit potential. Whether a seasoned veteran or a novice trader, embracing the art of chart analysis provides a competitive advantage in the ever-evolving world of financial markets.
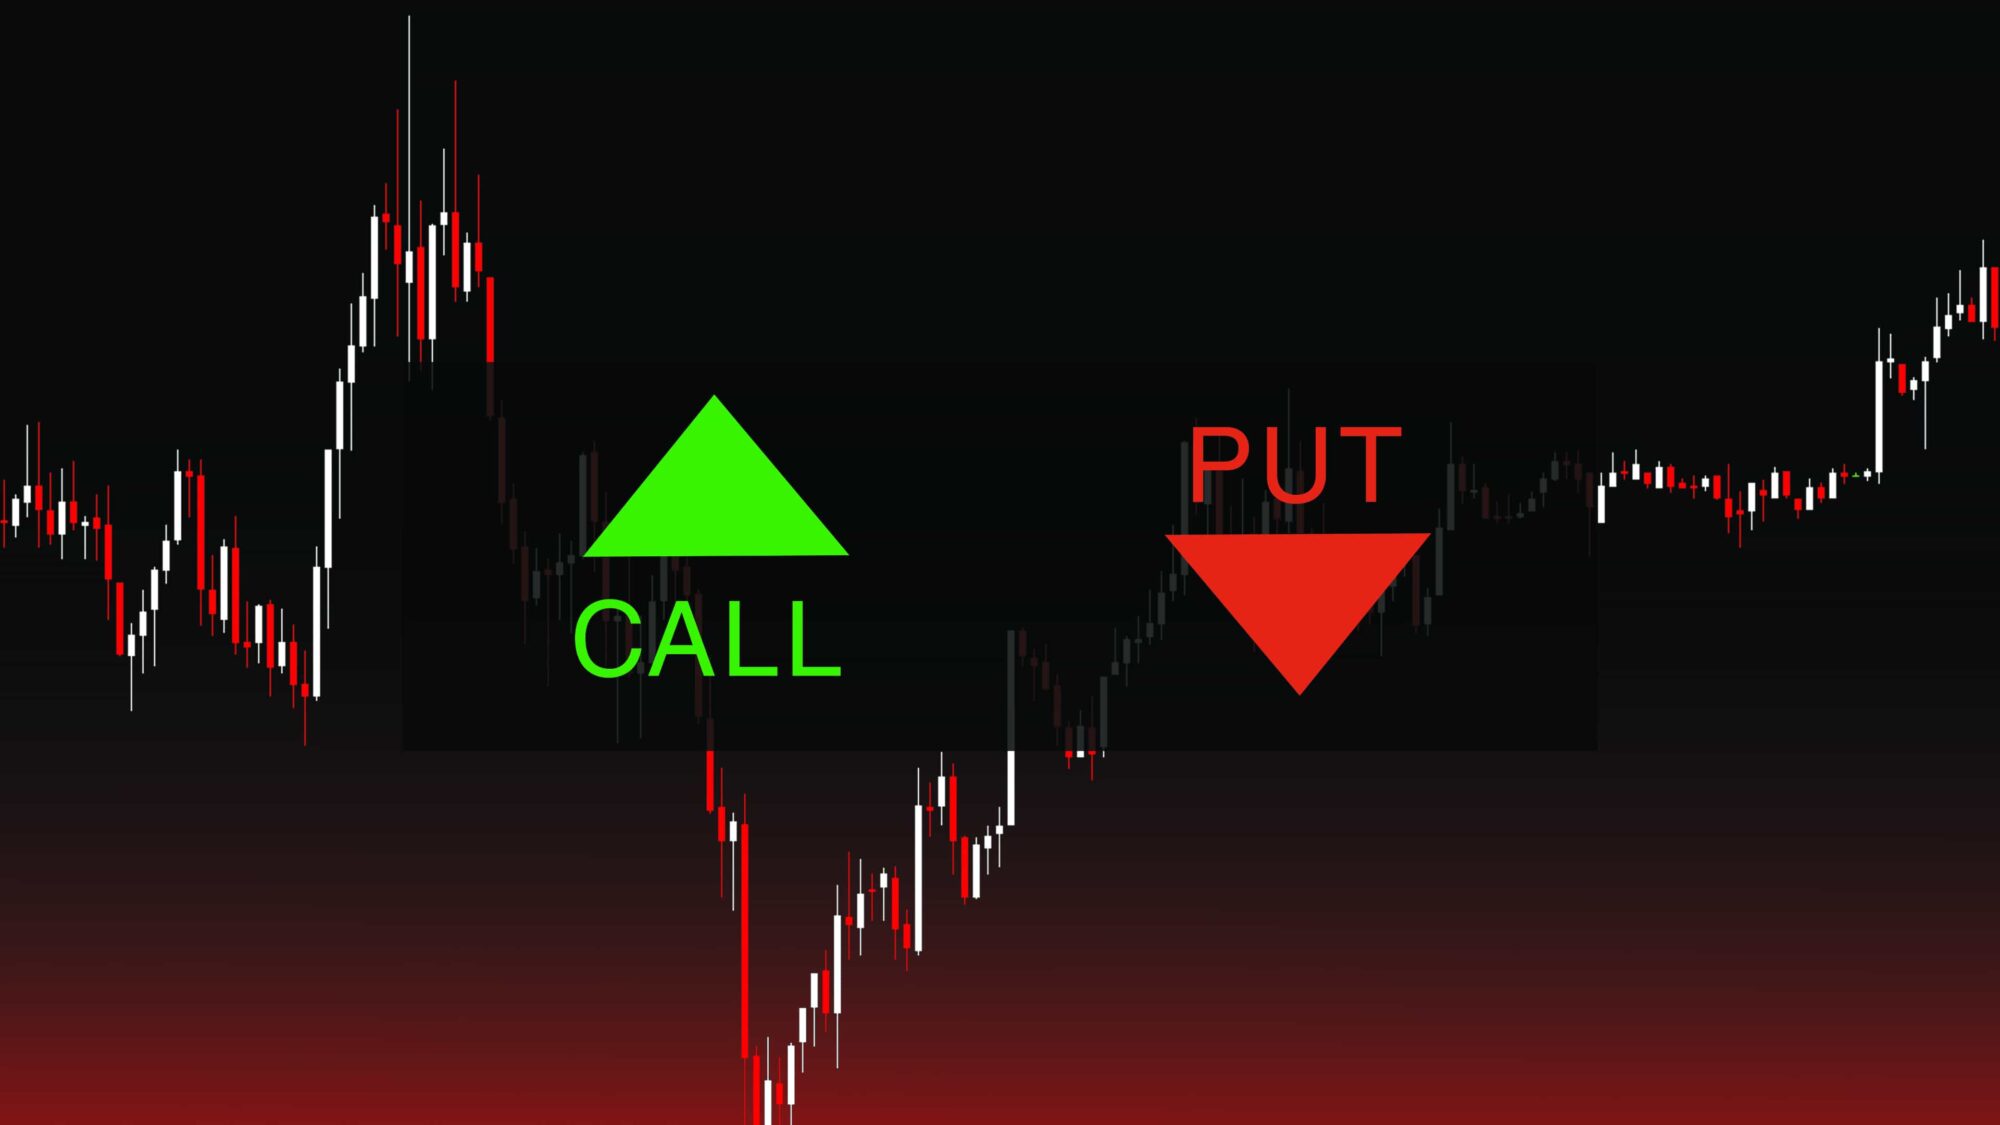
Image: www.asktraders.com
Options Trading Chart Analysis
https://youtube.com/watch?v=e4hr7IqEDaQ


