


Picture this: you’re at a bustling market, surrounded by vendors selling a variety of goods. As you scan the stalls, your eyes catch a glimpse of a vibrant tapestry adorned with intricate patterns. Upon closer examination, you realize it’s not just a piece of fabric—it’s a price chart of an options contract. In that instant, you know that you’ve stumbled upon a rich source of market insights, a visual masterpiece that can potentially guide your trading decisions.

Image: davida.davivienda.com
Options trading price charts are like mirrors into the market’s soul, reflecting its every move and emotion. They are indispensable tools for traders of all levels, offering a clear and concise representation of price action over time. By analyzing these charts, traders can identify trends, anticipate market movements, and make informed decisions that can lead to successful trades.
Understanding Options Trading Price Charts
Options contracts are derivative instruments that give the buyer the right, but not the obligation, to buy (in the case of call options) or sell (in the case of put options) an underlying asset at a specified price (the strike price) on or before a certain date (the expiration date). These contracts are traded on options exchanges, and their prices are constantly fluctuating based on various factors such as the underlying asset’s price, time to expiration, and market sentiment.
Key Features of Options Trading Price Charts
- X-Axis: Time
- Y-Axis: Price
- Candlesticks or Lines
- Indicators
The x-axis of an options trading price chart represents the time period over which the data is plotted. It can be a range of minutes (for short-term contracts) to years (for long-term contracts).
The y-axis of the chart displays the price of the options contract. This price can fluctuate rapidly, depending on market conditions.
Options trading price charts can use candlesticks or lines to represent price action. Candlesticks provide more detailed information, showing the opening and closing prices, as well as the high and low prices for each time period.
Technical indicators can be added to price charts to help traders identify trends and make trading decisions. Common indicators include moving averages, Bollinger Bands, and Relative Strength Index (RSI).
How to Analyze Options Trading Price Charts
- Identify Trends
- Support and Resistance Levels
- Price Patterns
- Volume and Interest
Trends are one of the most important things to look for when analyzing options trading price charts. An uptrend occurs when prices are rising, while a downtrend occurs when prices are falling. Traders can use technical indicators like moving averages to identify trends.
Support and resistance levels are important price levels that indicate where buying or selling pressure is concentrated. Support is a price level below the current price where buyers are likely to step in and prevent further declines, while resistance is a price level above the current price where sellers are likely to step in and prevent further rises.
Price patterns are repeating formations that can indicate the future direction of price action. Some common price patterns include double tops and bottoms, head and shoulders, and triangles.
Volume and interest are important indicators of market sentiment. Volume refers to the number of contracts traded over a certain period, while interest refers to the number of open positions (contracts that have not yet been closed). Increasing volume and interest can indicate a strong trend.
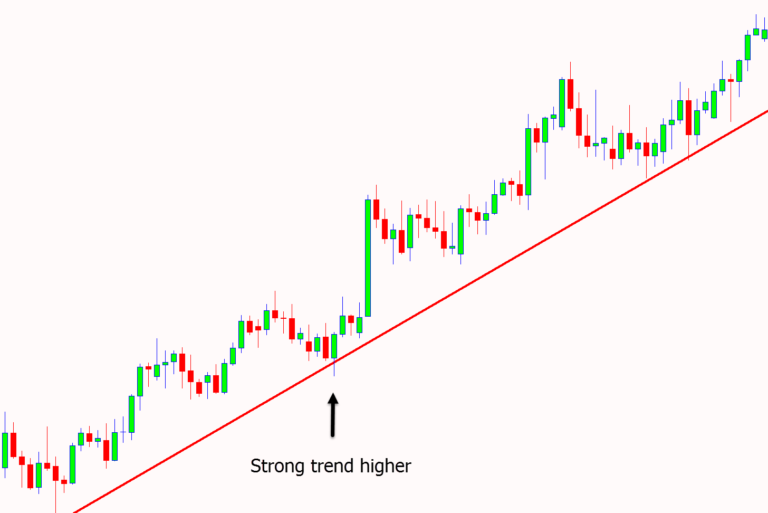
Image: learnpriceaction.com
Tips and Expert Advice for Analyzing Options Trading Price Charts
- Use Multiple Time Frames
- Be Aware of Market Conditions
- Use Technical Indicators Wisely
Analyzing price charts using different time frames can help traders identify trends and patterns that may not be visible on a single time frame.
Market conditions, such as news events and economic data, can have a significant impact on options pricing. Traders should be aware of these conditions when making trading decisions.
Technical indicators can be useful for identifying trends and opportunities, but traders should be cautious about relying too heavily on them. Indicators should be used in conjunction with other analysis techniques.
Options Trading Price Charts

Image: www.pinterest.com
FAQ on Options Trading Price Charts
- Q: What is the difference between candlesticks and lines on options trading price charts?
- A: Candlesticks provide more detailed information, showing the opening and closing prices, as well as the high and low prices for each time period. Lines simply connect the closing prices.
- Q: What is a moving average, and how is it used in options trading?
- A: A moving average is a technical indicator that smooths out price data by calculating the average price over a specified number of periods. Moving averages can be used to identify trends and support and resistance levels.
- Q: What is the importance of volume and interest in options trading price charts?
- A: Volume and interest are indicators of market sentiment. Increasing volume and interest can indicate a strong trend.
In conclusion, options trading price charts are indispensable tools for traders of all levels. By analyzing these charts, traders can identify trends, anticipate market movements, and make informed trading decisions. Whether you’re a seasoned veteran or just starting out on your options trading journey, understanding how to analyze price charts is essential for long-term success.
Are you ready to dive into the world of options trading price charts? Let us guide you on your journey, empowering you with the knowledge and expertise to navigate the markets with confidence.


