


Introduction
In the tumultuous realm of financial markets, option trading has emerged as a formidable force for astute investors seeking to amplify their returns and mitigate risks. Amidst the plethora of technical indicators, the Relative Strength Index (RSI) stands tall as a cornerstone tool, providing invaluable insights into market momentum and potential trading opportunities. Harnessing the power of this indicator can unlock the gateway to more informed and profitable option trades.

Image: www.tradingview.com
Delving into the Relative Strength Index
The RSI, a brainchild of legendary technical analyst J. Welles Wilder, is an oscillator that measures the magnitude and sustainability of price changes over a specified period. Calculated by comparing the average of closing gains to that of closing losses, the RSI oscillates between 0 and 100:
- RSI < 30: Indicates an oversold condition, suggesting a possible buying opportunity.
- RSI > 70: Indicates an overbought condition, suggesting a potential selling opportunity.
However, it is crucial to remember that these thresholds should not be considered rigid rules but rather as guiding principles. Market conditions, volatility, and individual risk tolerance should all be taken into account when making trading decisions.
RSI Application in Option Trading
In the realm of option trading, the RSI plays a multi-faceted role:
- Trend Identification: Rising RSI values reflect positive price momentum, while falling values indicate bearish pressure. This information can help options traders identify potential trend reversals and adjust their trading strategies accordingly.
- Support and Resistance Levels: RSI levels can serve as dynamic support and resistance levels, indicating areas where price is likely to pause or reverse. These levels can help traders determine potential entry and exit points for option trades.
- Overbought/Oversold Signals: Extreme RSI values provide warnings of potential overbought or oversold conditions. Option traders can use these signals to anticipate market corrections and adjust their positions accordingly.
Leveraging RSI for Effective Option Trades
To effectively incorporate RSI into option trading strategies, consider the following best practices:
- Identify Bullish or Bearish Divergence: When the RSI diverges from price action, it can provide valuable insights into potential trend reversals. Positive divergence (rising RSI despite falling prices) is a bullish signal, while negative divergence (falling RSI despite rising prices) is bearish.
- Utilize Moving Averages: Pairing the RSI with moving averages can enhance signal accuracy. For instance, an RSI that crosses above the 50-day moving average indicates bullish momentum, while a cross below the 50-day moving average suggests a bearish trend.
- Combine with Other Indicators: RSI, while powerful, is just one piece of the puzzle. Combining it with other indicators, such as volume and moving averages, can provide a more comprehensive view of market dynamics and improve trading decisions.

Image: bloghowtotrade.blogspot.com
Option Trading Rsi
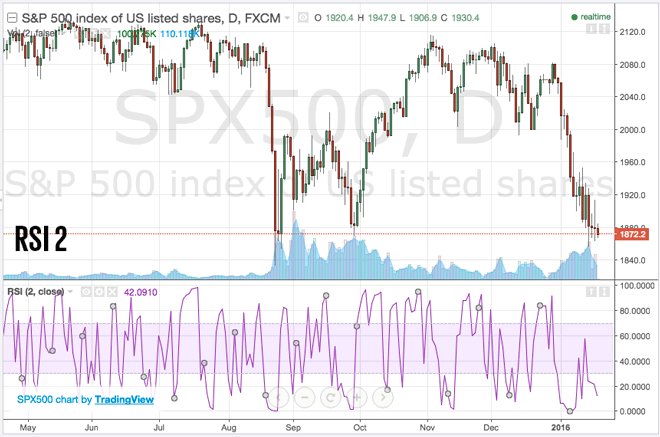
Image: dakoxok.web.fc2.com
Conclusion
In the hands of skilled traders, the RSI is an indispensable tool that unlocks the secrets of market momentum and potential trading opportunities. By comprehending the intricacies of this indicator and incorporating it into their option trading strategies, investors can navigate the volatile waters of financial markets with increased confidence and enhanced returns.
Remember, the key to successful option trading lies not solely in reliance on technical indicators but in the ability to interpret them effectively, manage risk prudently, and adapt to the ever-changing market landscape. Embrace the RSI as a valuable guiding force, but always combine it with sound judgment and a comprehensive understanding of options trading principles.


