


Have you ever wondered how seasoned traders decipher the intricate dance of options prices and predict market movements? The answer lies in the fascinating world of option trading charts. These graphical representations hold a wealth of information, providing traders with invaluable insights into market sentiment, volatility, and potential profit opportunities. But navigating this complex terrain can be daunting, especially for beginners. Fear not! This comprehensive guide will serve as your roadmap, guiding you through the intricacies of option trading charts and unlocking their secrets.
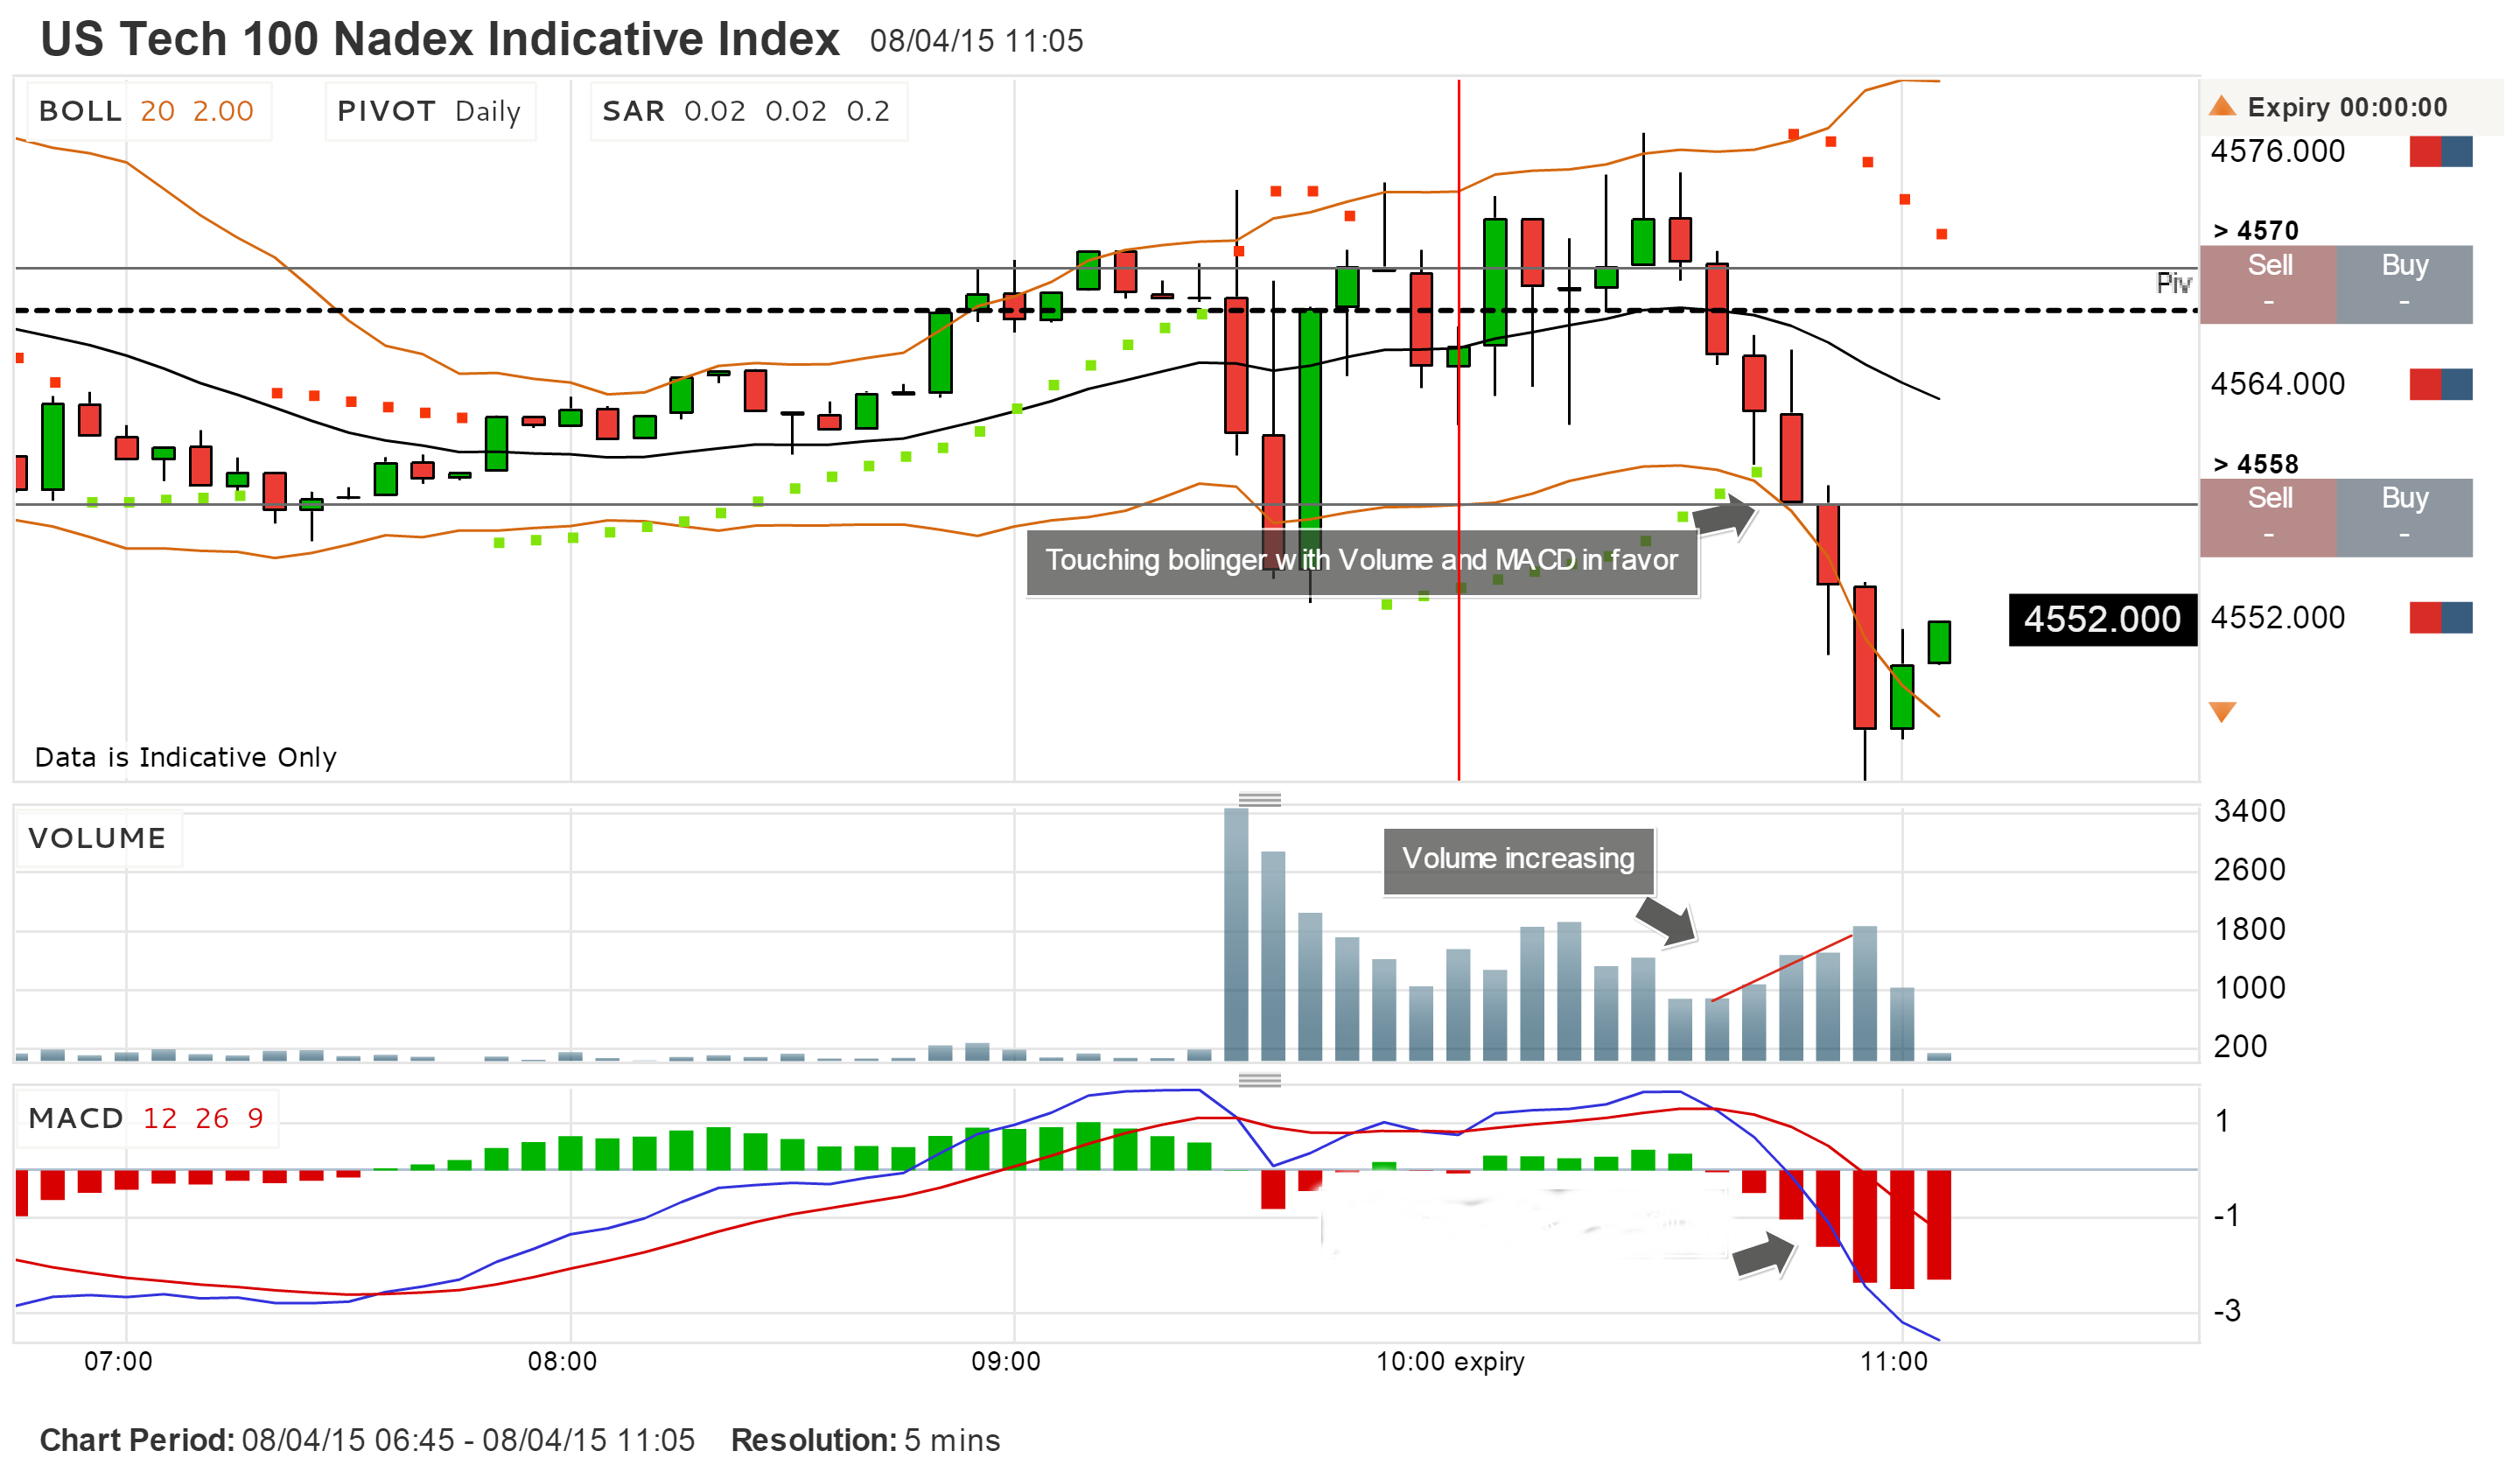
Image: www.binarytrading.com
Option trading charts are more than just pretty pictures. They are powerful tools that empower traders to make informed decisions. These charts reveal market trends, volatility patterns, and potential turning points, allowing traders to identify entry and exit points with greater accuracy. Whether you’re a seasoned trader looking to refine your strategies or a curious newbie eager to learn the ropes, this guide will equip you with the knowledge and understanding needed to confidently navigate the exciting world of option trading charts.
Demystifying Option Trading Charts: The Building Blocks
Understanding option trading charts begins with grasping the key concepts that drive their construction and interpretation.
1. Option Pricing Fundamentals
Option prices are not arbitrary; they are intricately tied to several variables, including:
- Underlying Asset Price: This is the price of the security (like a stock or index) on which the option is based.
- Strike Price: This is the price at which the option can be exercised.
- Time Value: This represents the portion of the option’s premium that is attributed to the time remaining until expiration.
- Volatility: This measures how much the underlying asset’s price is expected to fluctuate.
- Interest Rates: Higher interest rates generally lead to higher option prices.
2. Chart Types: Visualizing the Data
There are various chart types commonly used for analyzing option prices, including:
- Line Charts: These charts display the option’s price over time, connecting data points with a line.
- Bar Charts: Each bar represents the price range of the option during a specific period, showing the high, low, open, and closing prices.
- Candlestick Charts: These charts offer a more detailed view of price movement, encompassing the open, high, low, and close prices in a visual representation resembling candles.
Image: www.vrogue.co
3. Technical Indicators: Extracting Meaning
Beyond the basic chart types, technical indicators enhance the insights traders can glean. These indicators, calculated using mathematical formulas, can help identify trends, overbought or oversold conditions, and potential reversals:
- Moving Averages: These indicators smooth out price fluctuations, revealing underlying trends.
- Relative Strength Index (RSI): This indicator gauges the momentum of price movements, helping traders identify overbought and oversold conditions.
- MACD (Moving Average Convergence Divergence): This indicator highlights the relationship between two moving averages, potentially signaling trend changes.
Mastering the Art of Chart Analysis: Unveiling Options Insights
Armed with an understanding of the fundamentals, we can now delve into the techniques used to analyze option trading charts.
1. Trend Identification: Riding the Wave
Identifying the overall trend of the underlying asset is paramount. Trend lines drawn on charts can indicate upward (bullish), downward (bearish), or sideways (ranging) price movements. By recognizing the trend, traders can position themselves accordingly.
2. Volatility Analysis: Riding the Rollercoaster
Option prices are highly sensitive to volatility. Charts can reveal volatility patterns, helping traders understand the potential magnitude of price fluctuations. Higher volatility often translates to higher option premiums, while low volatility suggests less price movement.
3. Time Decay: Ticking Clock
Time decay is a critical factor for option sellers. Options lose value as time passes, especially in the last stages before expiration. Charts can help visualize this decay and guide traders on when to enter or exit trades strategically.
4. Chart Patterns: Uncovering Potential Reversals
Charts often exhibit recurring patterns that can signal potential price reversals. Familiarizing yourself with common patterns like head and shoulders, double tops, and triple bottoms can help anticipate market shifts and adjust your trading strategies.
Examples of Option Trading Charts in Action
Let’s bring these concepts to life with a few real-world examples.
1. Identifying a Bullish Trend in Apple Stock Options
Imagine analyzing a line chart of Apple stock options. If the chart consistently shows prices rising over time, this indicates a potential bullish trend. Traders may want to consider buying call options, hoping to benefit from further price increases.
2. Spotting a Breakout Pattern in Amazon Options
A candlestick chart of Amazon options reveals a clear breakout pattern. After a period of consolidation, the price suddenly breaks out of a range and moves significantly higher. Traders might use this pattern to identify potential entry points for buying call options.
3. Monitoring Volatility Using the Bollinger Bands
The Bollinger Bands, a technical indicator, are plotted on a chart to visualize price volatility. When the price moves outside the bands, it suggests a potential increase in volatility. This information can be crucial for traders, who may adjust their trades accordingly to manage risk or exploit increased price fluctuations.
Navigating Option Trading Charts: Essential Tips for Success
Mastering option trading charts takes time and practice. Here are some key tips:
- Start Simple: Begin with basic chart types and indicators. As your understanding grows, you can incorporate more advanced techniques.
- Choose the Right Charts: Select chart types that resonate with your trading style.
- Focus on Pattern Recognition: Practice identifying common chart patterns and their implications.
- Combine Technical Analysis with Fundamental Research: Don’t solely rely on technical analysis. Combine chart insights with fundamental research about the underlying asset.
- Utilize Backtesting: Test your trading strategies on historical data to refine your approach.
- Manage Your Risk: Never risk more than you can afford to lose.
The Power of PDFs: Making Option Trading Charts Accessible
Option trading charts are readily available in PDF format. PDFs provide numerous advantages for traders:
- Portability: Easily access charts on your computer, smartphone, or tablet.
- Print-Friendly Format: Print high-quality charts for detailed analysis and reference.
- Secure Sharing: Send charts securely to clients, colleagues, or mentors.
- Customizable: Annotate and mark up charts directly, adding personalized notes and insights.
Option Trading Charts Pdf
https://youtube.com/watch?v=e4hr7IqEDaQ
Conclusion: Embark on Your Option Trading Chart Journey
Option trading charts, especially in PDF format, offer a powerful and accessible way to gain invaluable insights into the market. This comprehensive guide has equipped you with the fundamental knowledge and practical tips to begin your journey into the world of option chart analysis. Embrace the process, refine your strategies, and embark on a path towards greater trading success.


