


Have you ever felt the exhilarating rush of making a profitable options trade? It’s a unique blend of strategy, timing, and luck that has the potential to amplify your returns. However, navigating the complex world of options trading requires a keen eye for indicators and patterns that can guide you toward informed decisions. In this article, we’ll delve into the secrets of option trading indicators and patterns, empowering you to increase your profitability and minimize risk.
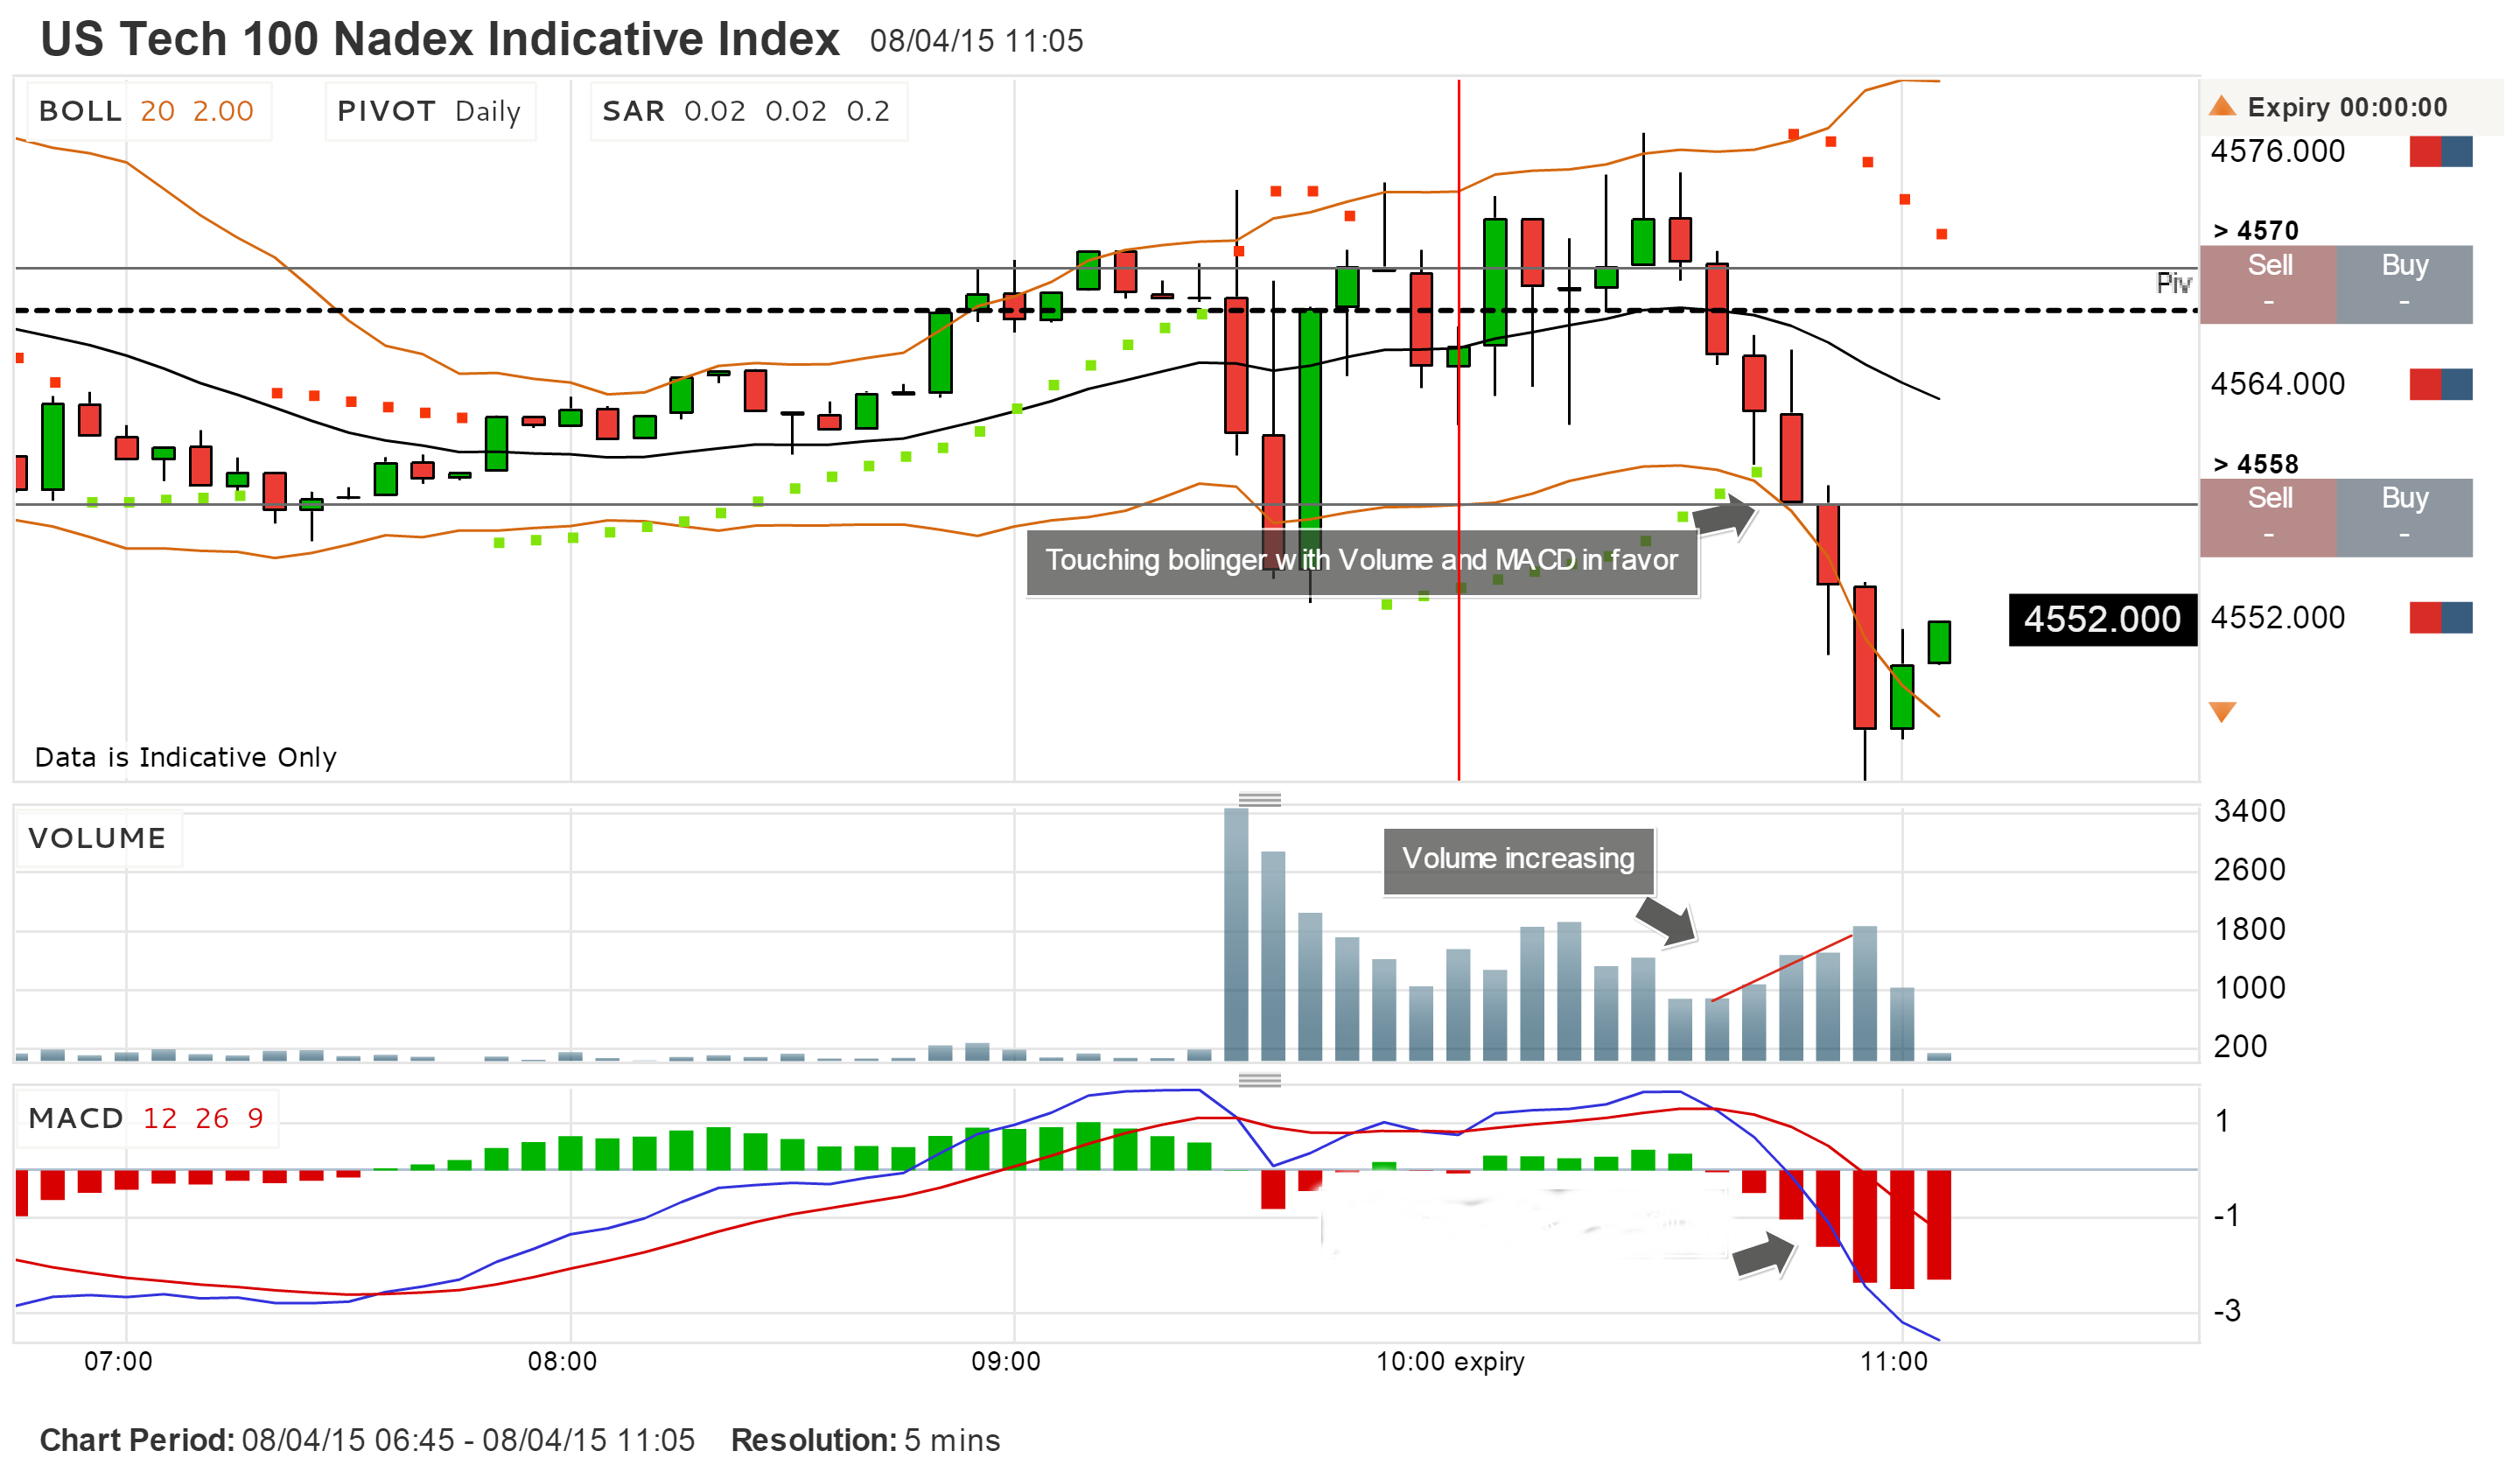
Image: tujogim.web.fc2.com
Seeking Clues in Market Behavior
Indicators and patterns are vital tools in the options trader’s arsenal, providing insights into market behavior and potential price movements. Indicators like Moving Averages, Bollinger Bands, and Relative Strength Index (RSI) can assess market trends, momentum, and overbought/oversold conditions. By interpreting these indicators, traders can identify potential entry and exit points, optimizing their trades.
Patterns, on the other hand, are recurrent price formations that often precede predictable market movements. Familiarizing yourself with patterns like double tops and bottoms, head and shoulders, and wedges can give you a competitive edge, allowing you to anticipate future price movements and make informed trading decisions.
Unveiling the Power of Indicators
The Moving Average (MA) is a widely used indicator that calculates the average price of an asset over a specified period. It helps traders identify trends and potential reversals by smoothing out price fluctuations. Bollinger Bands, another popular indicator, construct an upper and lower band around the MA, indicating potential areas of support and resistance.
The RSI is an oscillator that measures the magnitude of recent price changes, highlighting overbought and oversold conditions. Traders use RSI to identify potential divergences between price and momentum, indicating possible reversals. These indicators, in conjunction with other technical analysis tools, provide a robust framework for decision-making.
Harnessing the Wisdom of Patterns
Double tops and bottoms are reversal patterns that signal a change in market sentiment. A double top indicates a failed upward breakout and potential reversal, while a double bottom suggests a failed downward breakdown and a potential uptrend.
The head and shoulders pattern is a bearish reversal pattern consisting of three consecutive lower highs and lower lows. It often signals a trend reversal, with the neckline formed by the two lower lows acting as a crucial support level. Wedges are triangular patterns that converge at a point, predicting a breakout either upward or downward, depending on the direction of the trend.
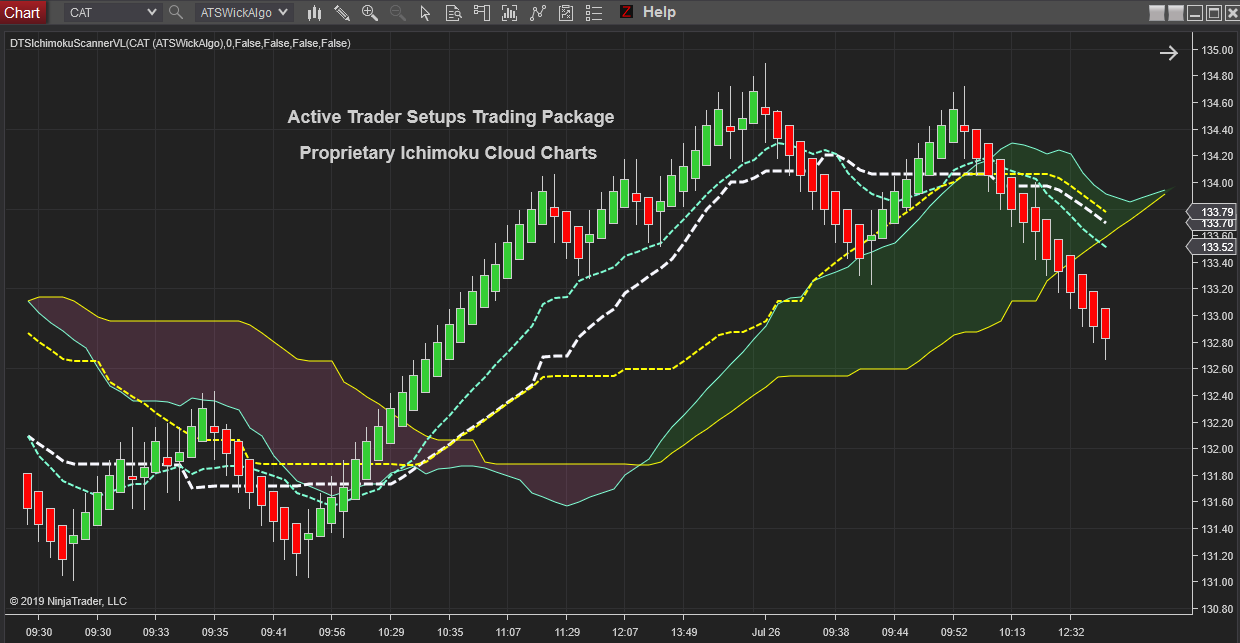
Image: activetradersetups.com
Professional Insights for Enhanced Success
“Always trade with a plan and risk management strategy,” advises seasoned options trader John Carter. “Understanding your risk tolerance is key to making sound decisions.”
“Pay close attention to market sentiment and news events,” adds veteran trader Peter Brandt. “They can significantly impact market behavior and influence trading opportunities.”
These expert insights underscore the importance of a comprehensive approach to options trading. By integrating indicators, patterns, and market analysis, you can increase your chances of success and minimize risk.
FAQs for Aspiring Traders
- What is the best option trading indicator?
There is no single “best” indicator. Different indicators serve different purposes and are effective in specific scenarios. It’s essential to experiment and determine the indicators that suit your trading style and market conditions. - How can I identify reliable patterns?
Reliable patterns are usually accompanied by high volume and occur during significant price movements. Confirmation from multiple indicators and technical analysis can enhance the reliability of a pattern recognition. - What is the most important factor in successful options trading?
The most crucial factor is risk management. Understanding your risk tolerance, setting realistic profit targets, and implementing stop-loss orders are essential for preserving capital and mitigating losses. - Can I become a profitable options trader without prior experience?
While prior experience is beneficial, it is possible to become a profitable options trader without it. However, extensive research, education, and practice are necessary to develop the skills and knowledge required for success.
Option Trading Indicators And Patterns For Increasing Profits
Conclusion
掌握オプション取引の指標とパターンは、収益性を高め、リスクを軽減するための鍵となる。Moving Averages、Bollinger Bands、RSI などの指標を解釈することにより、市場のトレンドと勢いを理解できます。また、Double Tops and Bottoms、Head and Shoulders、Wedges などのパターンを認識することで、将来の価格変動を予測し、賢明な取引判断を行うことができます。専門家の洞察、FAQ、そして継続的な学習と練習を組み合わせることで、オプション取引の真のマスターとなり、市場の機会を最大限に活用できます。このエキサイティングな金融の世界に興味がありますか?学び続け、スキルを磨き続けましょう。成功はすぐそばにあるかもしれません。


