


Have you ever felt like you’re constantly chasing a moving target in the world of option trading? One day an indicator seems like the key to unlocking consistent profits, only to falter the next. The truth is, there’s no single “best” indicator for predicting the future of an option’s price. Instead, successful option traders understand that it’s about building a toolbox of indicators, each with a specific purpose, to gain a comprehensive view of the market.
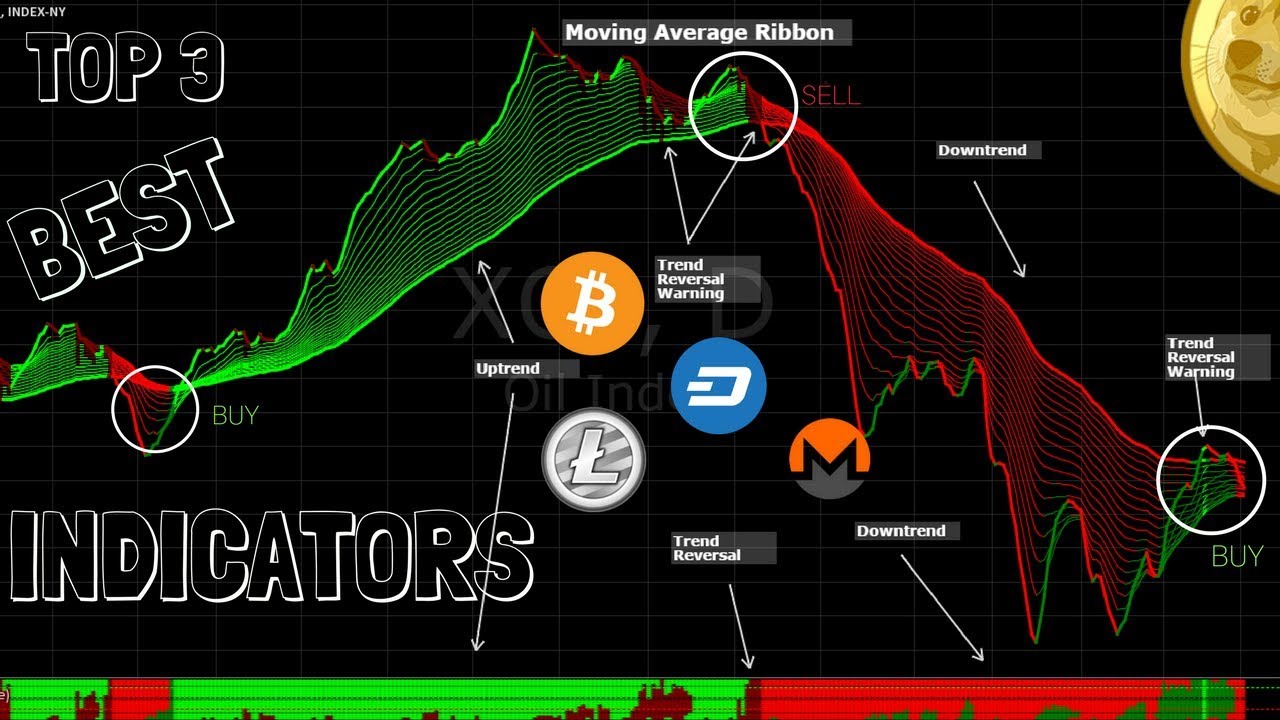
Image: tradingforexguide.com
But before we delving into the specifics of option trading indicators, let’s define the landscape. Option contracts, unlike standard stocks, offer the ability to buy or sell an underlying asset at a predetermined price within a specific timeframe. This flexibility makes them powerful tools, but also introduces complexity. Indicators are essential guides for navigating this complexity, allowing traders to assess market sentiment, identify potential turning points, and calculate risk/reward ratios.
Understanding the Role of Indicators in Option Trading
Think of indicators as your personal financial analysts, providing valuable insights into market trends and patterns. They are not magic formulas, but rather tools that help you interpret data in a meaningful way. Traders use indicators to:
- Identify Overbought/Oversold Conditions: Indicators help traders understand if a stock is being traded at a price that’s too high or too low compared to its historical performance. This is invaluable for identifying potential reversals.
- Pinpoint Support and Resistance Levels : Indicators can assist in pinpointing specific price levels where a stock is likely to bounce back or face resistance, informing entry and exit points.
- Evaluate Momentum and Trend Strength: Indicators can provide insights into the speed and direction of price movements, helping traders identify potential breakout or breakdown opportunities.
- Measure Volatility: Indicators can assess the magnitude of price swings, giving traders a sense of the risk involved in options contracts.
Popular Option Trading Indicators: A Deep Dive
1. Moving Averages (MA)
Moving Averages are among the most widely used indicators, smoothing out price fluctuations to highlight trends. They represent the average price of a security over a specified time period. Common types of MAs include Simple Moving Average (SMA), Exponential Moving Average (EMA), and Weighted Moving Average (WMA).
How Traders Use Moving Averages:
- **Trend identification:** When a price crosses above a long-term moving average (often a 200-day MA), it indicates an uptrend. Crossing below suggests a downtrend.
- **Support/Resistance:** As with other indicators, MA levels can act as potential support and resistance zones.
- **Divergence:** A divergence occurs when the price trend goes in the opposite direction of the moving average, potentially signalling a trend change.

Image: www.youtube.com
2. Bollinger Bands®
Bollinger Bands® are a volatility indicator that creates a range around a moving average, typically a 20-day SMA, to identify price swings and potential reversals. The bands represent standard deviations from the moving average, indicating the level of market volatility.
How Traders Use Bollinger Bands®:
- **Volatility Assessment:** Wider bands suggest higher volatility, while narrower bands indicate lower volatility.
- **Overbought/Oversold:** When prices touch or break through the upper band, it can signal overbought conditions. Conversely, breaching the lower band can signal an oversold market.
- **Confirmation of Trend Strength:** When prices stay within the bands, it suggests a range-bound market, while strong breakouts beyond the bands indicate momentum.
3. Relative Strength Index (RSI)
The RSI is a momentum oscillator ranging from 0 to 100 that measures the magnitude of recent price changes to evaluate overbought and oversold conditions. Readings above 70 are generally considered overbought, while readings below 30 suggest oversold conditions.
How Traders Use the RSI:
- **Identifying Overbought/Oversold:** The RSI can signify potential reversals. Overbought conditions create opportunities for short selling, while oversold opportunities favour buying.
- **Divergence:** A divergence occurs when the RSI shows different signals than the price trend. For instance, if the RSI makes a lower high while the price makes a higher high, it can indicate a possible trend reversal.
4. Stochastic Oscillator
The Stochastic Oscillator is a momentum indicator that compares a security’s closing price to its price range over a specific period. It ranges from 0 to 100, with readings above 80 being overbought and below 20 oversold.
How Traders Use the Stochastic Oscillator:
- **Identifying Overbought/Oversold:** The Stochastic Oscillator helps identify potential overbought and oversold conditions for early entries and exits.
- **Momentum confirmation:** Convergence and divergence between the oscillator and price can signal changes in momentum.
- **Crossovers:** Crossovers between the two lines of the Stochastic Oscillator often signal potential trend changes.
5. MACD (Moving Average Convergence Divergence)
The MACD is a trend-following indicator that compares two moving averages to gauge momentum and identify potential trend reversals. It consists of a MACD line, a signal line, and a histogram.
How Traders Use the MACD:
- ** Trend Confirmation:** A MACD crossover above the signal line suggests an uptrend, while a crossover below indicates a downtrend.
- **Divergence:** Divergence between the MACD and price can signal a potential trend reversal.
- **Momentum:** The histogram provides a visualization of the momentum of the MACD line, helping traders assess trend strength.
Building Your Option Trading Toolbox: A Strategy for Success
Remember, indicators are tools, not prophecies. No single indicator is foolproof, and relying on a single one is asking for trouble. Instead, focus on building a diverse toolbox with multiple indicators to achieve a balanced perspective.
Key Strategies to Consider:
- **Combine Trend-Following and Momentum Indicators:** Use moving averages to identify the overall trend and then combine them with momentum oscillators like RSI or MACD to confirm entries and exits.
- **Prioritize Confirmation:** Don’t rely on just one indicator to make decisions. Whenever possible, seek confirmation of signals across multiple indicators, building confidence in your trading strategies.
- **Backtesting is Your Friend:** Before implementing a strategy in real-world trading, backtest your chosen indicators and combinations on historical data to measure their effectiveness and potential profitability.
- **Stay Disciplined with Stop-Loss Orders:** Limit potential losses through disciplined stop-loss orders. Option strategies, especially those with leveraged positions, can amplify losses quickly.
Beyond Indicators: The Holistic Approach to Success
While indicators are essential for navigating the complexities of option trading, they are not the entire equation. Remember, option trading involves a combination of technical analysis, fundamental analysis, risk management, and psychology.
Essential Considerations Beyond Indicators:
- **Fundamental Analysis:** Understand the underlying asset’s business fundamentals and economic factors to gain a better understanding of the stock’s long-term prospects.
- **Risk Management:** Implement sound risk management techniques, such as limiting position size and using stop-loss orders, to minimize potential losses.
- **Trading Psychology:** Develop a disciplined and emotionally stable approach to trading. Avoid chasing losses or letting emotions cloud your judgment.
- **Continuous Learning:** Stay updated on market trends, economic developments, and new trading strategies to stay ahead of the curve.
Best Indicator For Option Trading
https://youtube.com/watch?v=4YJUdVk7CFc
Conclusion: The Journey to Option Trading Mastery
The quest for the “best” indicator for option trading is ultimately a pursuit of knowledge and understanding. No single indicator holds the key to consistent profits, but rather a collection of tools and strategies must be employed combined with a deep understanding of market dynamics, fundamentals, and trading psychology. It’s a never-ending journey of learning, adaptation, and discipline. By embracing this holistic approach, traders can equip themselves with the knowledge and skills to navigate the exciting and unpredictable world of options trading.


