


Binary options have emerged as a popular financial instrument offering traders the potential for high returns in a short period. Among the various technical indicators used to analyze market conditions and make informed trading decisions, the Stochastic Oscillator stands out as a reliable tool. This article explores the Stochastic Oscillator, its fundamental principles, and how traders can effectively utilize it in their binary options trading strategies.
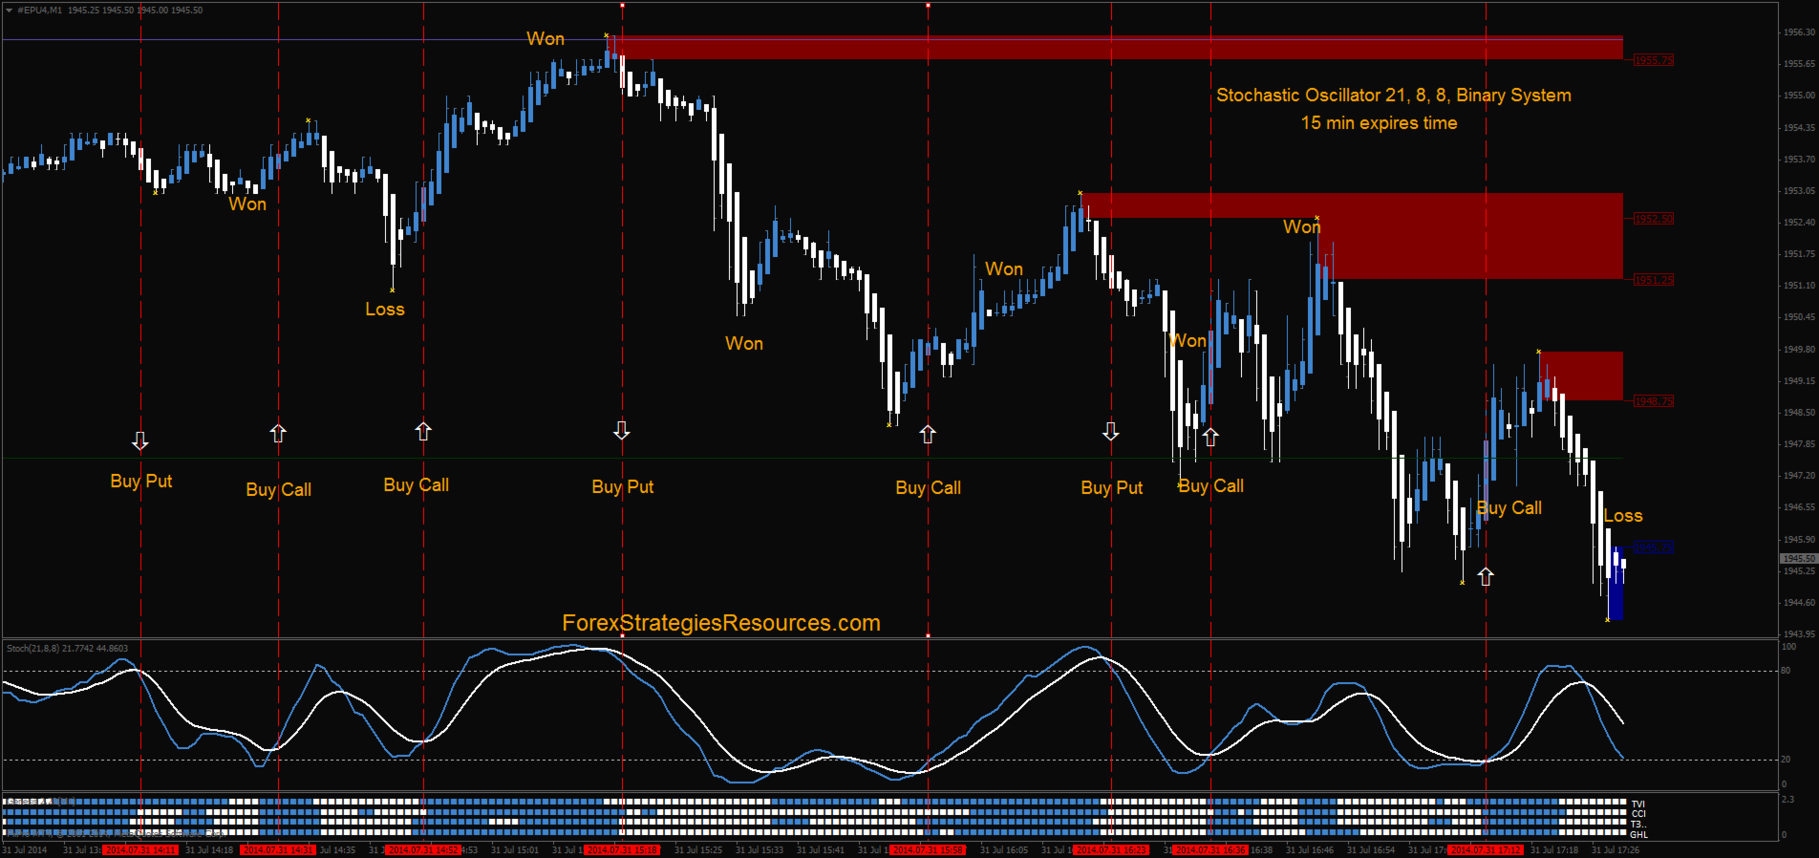
Image: www.forexstrategiesresources.com
Understanding the Stochastic Oscillator
The Stochastic Oscillator, developed by George Lane in the 1950s, is a momentum indicator that measures the relationship between the closing price of an asset and its price range over a specific period. It compares the closing price to the highest high and lowest low within that period, typically 14 or 5 trading days.
The Stochastic Oscillator is represented as a line that oscillates within a range of 0 and 100. When the line is approaching 100, it indicates that the asset is overbought, and a potential reversal to the downside may occur. Conversely, when the line is approaching 0, it suggests the asset is oversold, and a possible bounce-back to the upside is expected.
Trading Binary Options Using the Stochastic Oscillator
Traders can effectively incorporate the Stochastic Oscillator into their binary options trading strategies as follows:
Overbought/Oversold Levels: When the Stochastic Oscillator line crosses above 80, it often signals an overbought market condition, and traders can consider placing a “Put” option (Betting on a price decline). Conversely, when the line crosses below 20, it indicates an oversold condition, and traders may opt for a “Call” option (Betting on a price increase).
Overbought/Oversold Divergences: Divergences occur when the Stochastic Oscillator line and the price action move in opposite directions. If the price is making higher highs while the Stochastic Oscillator is making lower highs, it points to a bearish divergence, increasing the likelihood of a price reversal. Similarly, if the price is making lower lows while the Stochastic Oscillator is creating higher lows, it indicates a bullish divergence, suggesting a potential trend continuation.
K% and D% Lines: The Stochastic Oscillator consists of two lines: the %K line and the %D line. The %D line is a three-period moving average of the %K line and serves as a confirmation signal. Traders often look for a crossover between the %K and %D lines to confirm a potential trading opportunity.
Example: Let’s consider a scenario where the Stochastic Oscillator line is rising and exceeds the 80 level while the price action forms lower highs. This would indicate a bearish divergence (overbought situation), signaling a potential opportunity to place a “Put” option, anticipating a decline in price.

Image: www.forex-strategies-forum.com
Trading Binary Options With Stochastic Oscillator

Image: www.youtube.com
Conclusion
By leveraging the Stochastic Oscillator, traders can gain valuable insights into market momentum and make informed trading decisions. It assists in identifying potential trend reversals, overbought/oversold conditions, and provides confirmation signals for trades. While the Stochastic Oscillator is a powerful tool, it’s important to use it alongside other technical indicators and fundamental analysis for a more comprehensive approach to binary options trading.


