


An Introduction to Live Option Trading Charts
For stock traders, the live chart has long been an invaluable tool, providing real-time insights into price movements and market trends. Now, the same benefits can be extended to option traders, opening up unprecedented opportunities for risk management and profit maximization.

Image: margintradeab.blogspot.com
Live option trading charts are specialized software that stream option-specific data and display it in real-time, enabling traders to monitor market activity and make informed trading decisions. They provide a dynamic visualization of option prices, volatility, implied volatility, and other key metrics, offering a comprehensive view of the market landscape.
Demystifying Key Concepts
Before exploring the benefits of live charts, it’s crucial to understand the fundamental concepts of option trading:
Options: Options are contracts that grant the buyer (holder) the right, but not the obligation, to buy (in the case of a call option) or sell (in the case of a put option) an underlying security at a specified price on or before a predetermined date.
Option Price: Option prices fluctuate constantly, influenced by factors such as the underlying security’s price, time until expiration, and implied volatility.
Volatility: Volatility measures the degree of price fluctuations in the underlying security, with higher volatility indicating greater potential for price swings.
Implied Volatility: Implied volatility reflects the market’s expectation of future volatility, influencing option pricing and profitability.
Benefits of Live Option Trading Charts
Empowered with real-time market data, live option trading charts offer numerous advantages:
Real-Time Price Tracking: Track the live prices of options contracts and identify potential trading opportunities as they emerge.
Historical Data Analysis: Study historical option prices to identify patterns, trends, and support and resistance levels that can inform trading strategies.
Volatility Assessment: Monitor volatility levels in real-time to gauge market sentiment and adjust trading strategies accordingly.
Option Chain Visualization: Gain a comprehensive view of the entire range of option contracts available for a specific underlying security, enabling traders to compare prices and maturities.
Chart Patterns Identification: Identify technical trading patterns and indicators to predict price movements and improve decision-making.
Real-Time Risk Management: Monitor option Greeks (delta, gamma, theta, etc.) to track risk parameters and make timely adjustments to protect capital.
Trading Strategies with Live Charts
Live option trading charts not only provide valuable data but also support a range of trading strategies:
Passive Income Generation: Earn a steady stream of income by selling options premiums, using charts to identify favorable odds and manage risk.
Hedging Positions: Protect existing stock positions against price fluctuations by purchasing put options or using charts to implement complex hedging strategies.
Trading Market Sentiment: Gauge market sentiment by analyzing implied volatility levels and identifying discrepancies between actual and expected volatility.
Capture Premium Decay: Profit from the time decay of option premiums by selling premiums with shorter expirations and using charts to track theta values.
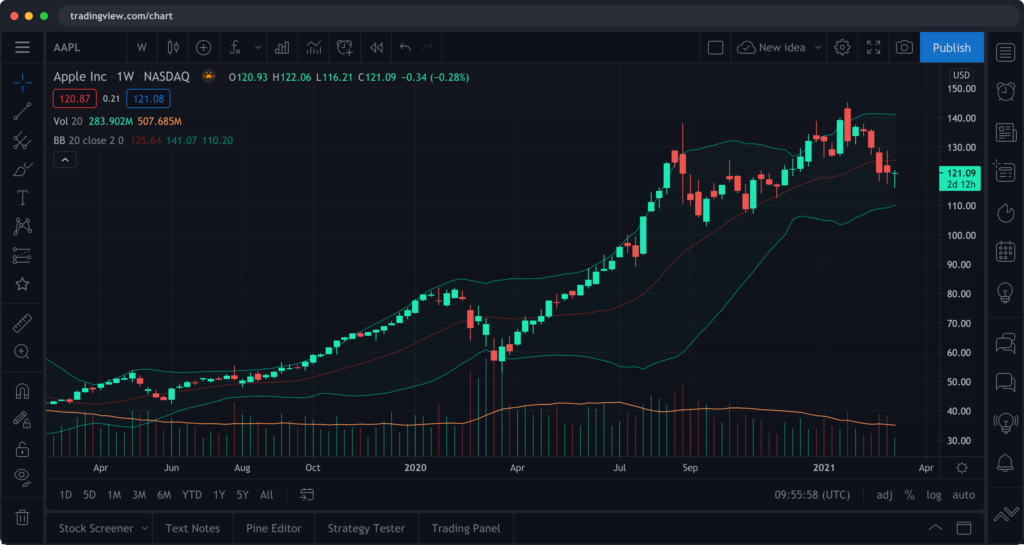
Image: riset.guru
Option Trading Live Chart
https://youtube.com/watch?v=hFItRrMXAE4
Conclusion
Live option trading charts have revolutionized the way options traders analyze the market and make informed decisions. By providing real-time data, historical analysis, and advanced charting capabilities, these tools empower traders with the insights needed to navigate market complexities, optimize strategies, and maximize profitability. Embrace live option trading charts to unlock the full potential of this dynamic asset class and elevate your trading game.


